Tableau TDS-C01 Tableau Desktop Specialist Exam Practice Test
Tableau Desktop Specialist Questions and Answers
What are two examples of a date value?
Choose two.
What are two requirements to combine two tables by using a union? Choose two.
You have cleaned a data source properly, created some calculated fields and renamed some columns. You want to save these changes for future use cases. Which of the following would BEST satisfy this requirement?
For Bullet Graphs we need at least ____________ measures
How can you change the Default Aggregation for a measure in Tableau?
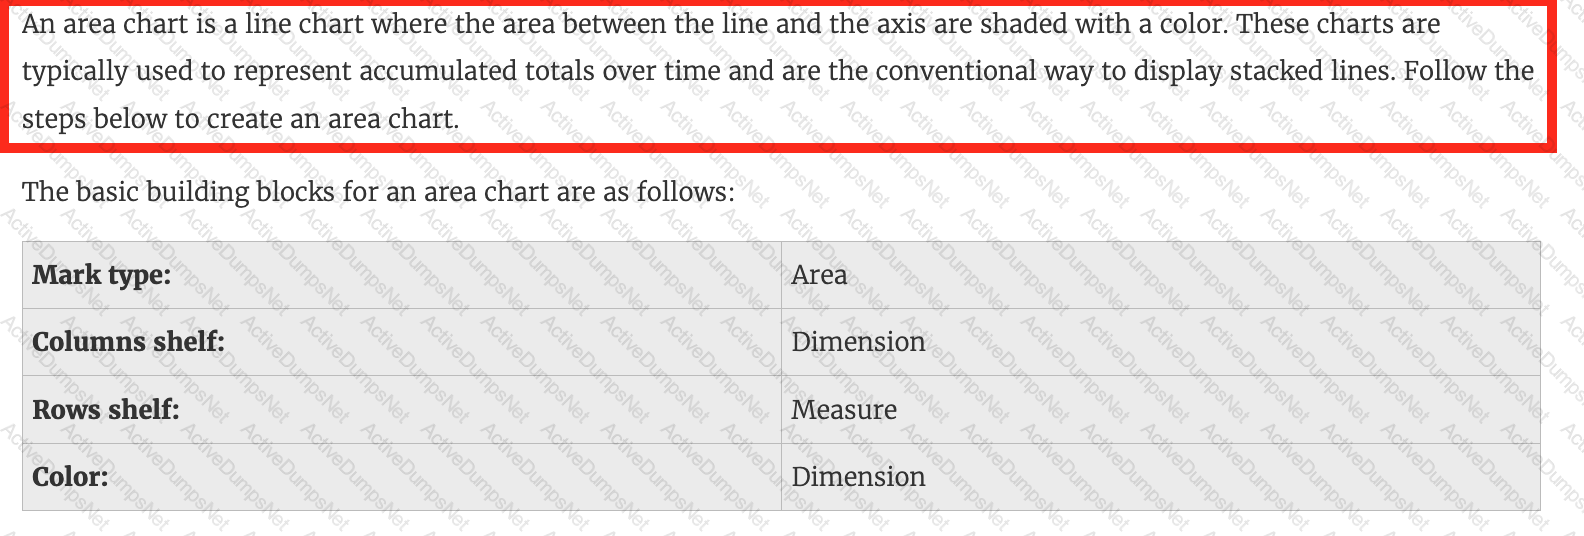
_____________ charts are typically used to represent accumulated totals over time and are the conventional way to display stacked lines.
Which of the following URL prefixes are permitted when creating a URL Action in Tableau?
Which of the following are valid reasons to use a Tableau Data Extract (.tde) over Live Connections?
Which of the following is NOT a valid official data source in Tableau Desktop?
True or False: LEFT JOIN returns all rows from the left table, with the matching rows in the right table
Using the Geo Data table, create a Bar chart showing the In-Stock percentage for each Color. What is the Average In-Stock percentage for the Color Red? Present your answer correctly upto 2 decimal places.
By default, measures placed in a view are aggregated. The type of aggregation applied ______________
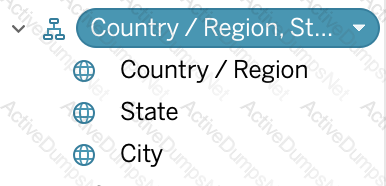
What are two use cases for creating hierarchies from the Data pane? Choose two.
True or False: Enabling any other type of sort (Field, alphabetic, or Nested) clears the manual sort we create.
______________ refers to the level of detail for a piece of data, wherever you are looking.
Suppose I have the following view. What will be the total number of marks if I drag a new measure to the row shelf vs the column shelf?
What are two use cases for a story? Choose two.
The default path for all supporting files, data sources, icons, logs etc is in ______________________
A Tableau Support case can be opened in which of the following valid ways?
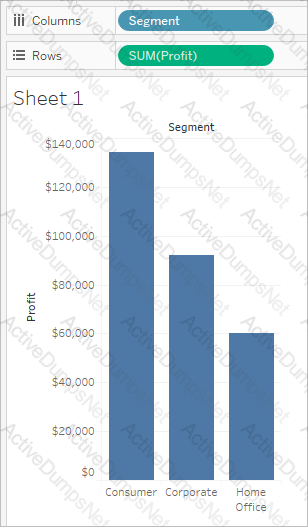
Which of the following is the correct way to calculate Profit Ratio in Tableau?
When should you use a relationship instead of a join for two data sets?
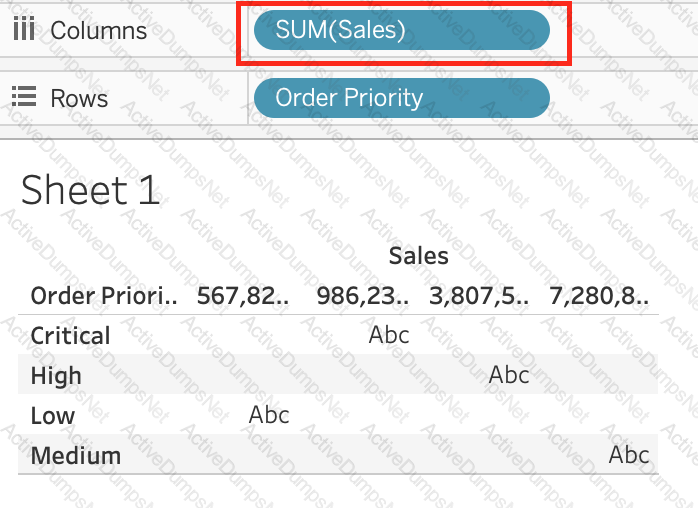
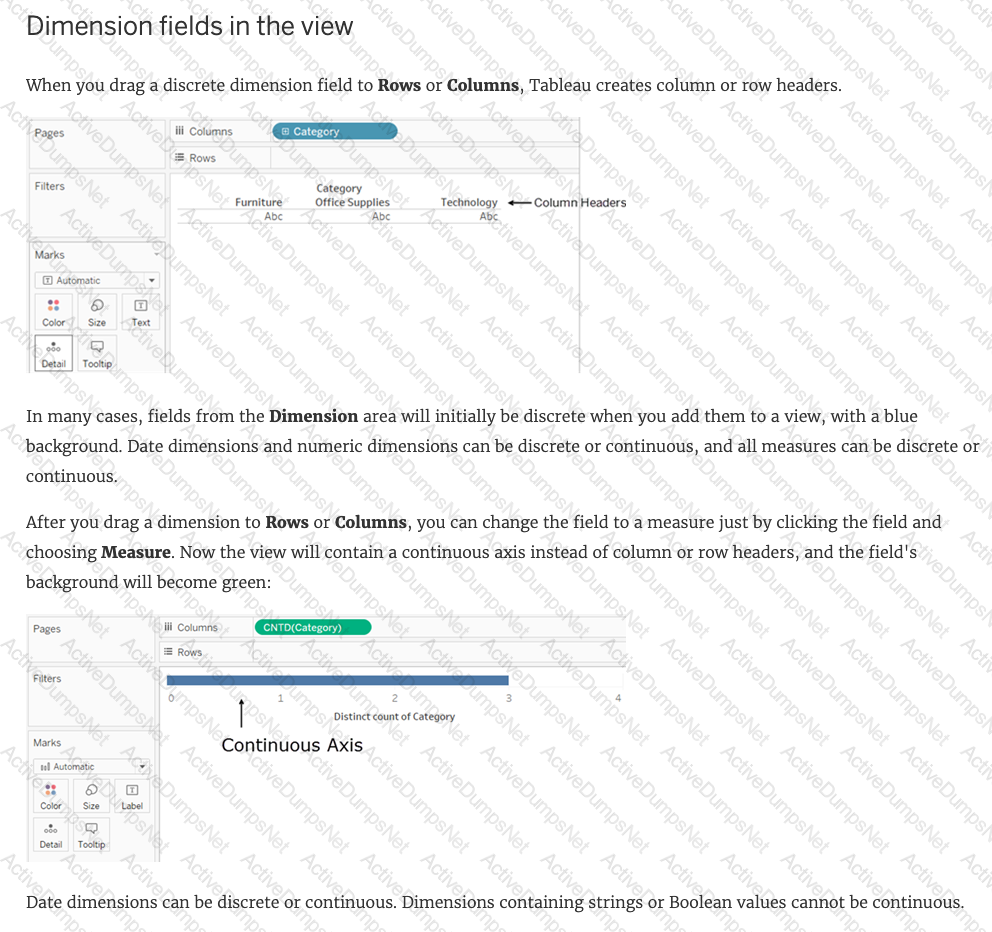
What should you use to create headers in a visualization?
By definition, Tableau displays measures over time as a ____________
Which of the following chart type makes use of 'binned' data?
What are three geographic roles that you can assign to a field? Choose three.
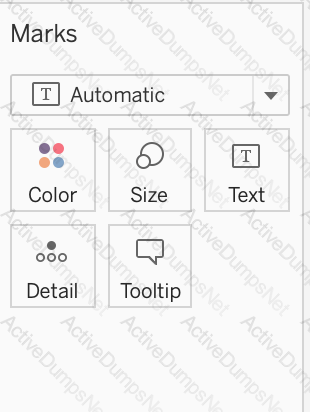
Which of the following would you use to edit the Shape, colour, and Text of your visualisations?
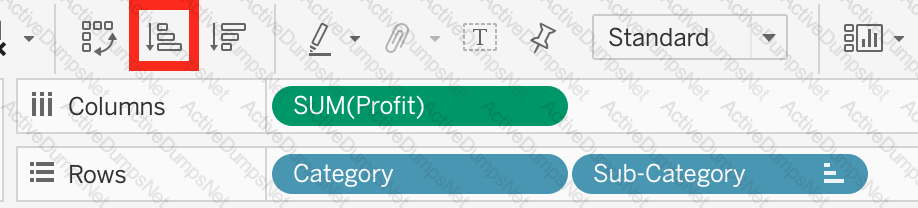
What does the following icon do in Tableau?
Larger image
Which type of date filter can you use to choose a range of dates based on TODAY ()?
You create a visualization by first adding a measure to rows. Next, you add a dimension wilh 11 members to columns.
Assuming that all the dimensions have a non-zero value, how many marks are in the view before and after the dimension is added?
What is created by a calculated field that has a formula of SUM(Sales)/SUM(Profit)?
What allows you to drill up or down in the level of detail (LOD)?
In order to avoid any confusions, what should you do after creating a Dual-axis chart?
 Graphical user interface, chart, line chart
Description automatically generated
Graphical user interface, chart, line chart
Description automatically generatedTrue or False: Tableau can create worksheet-specific filters
What is a Tableau story point?
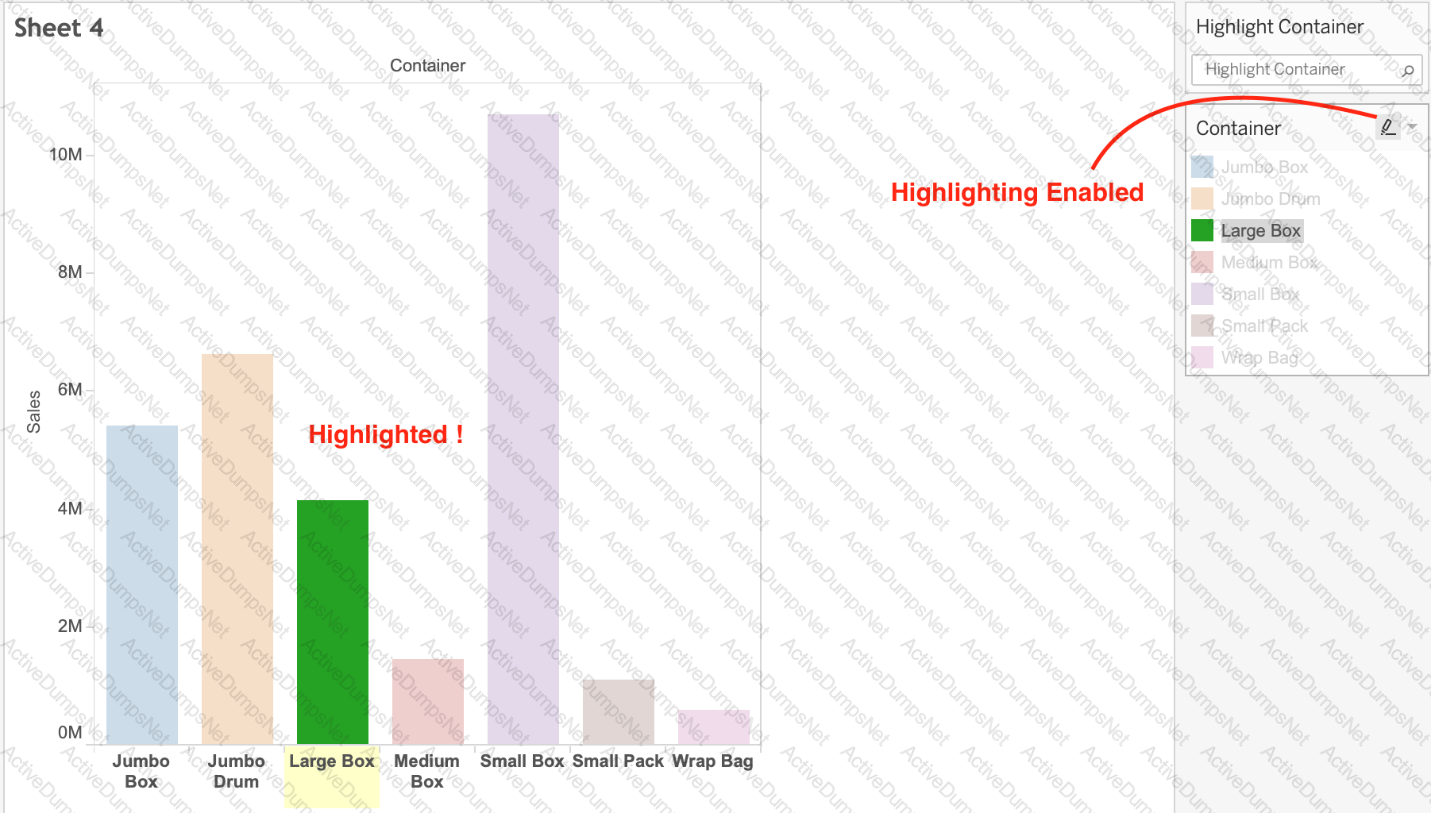
__________ is a technique in Tableau which will identify marks with similar characteristics
Which of the following are valid ways to export a dashboard with multiple visualisations as an image?
Which of the following is a discrete date part?
When using a data source that has relationships, how can you add a join between two or more tables?
Which of the following would you use to connect to multiple tables in a single data source at once?
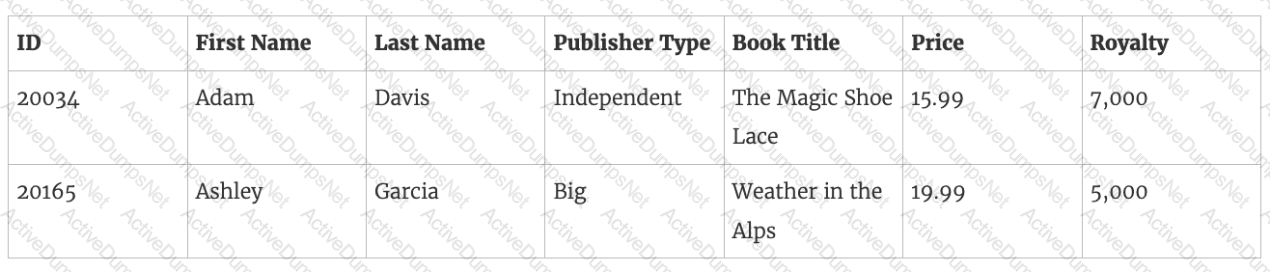
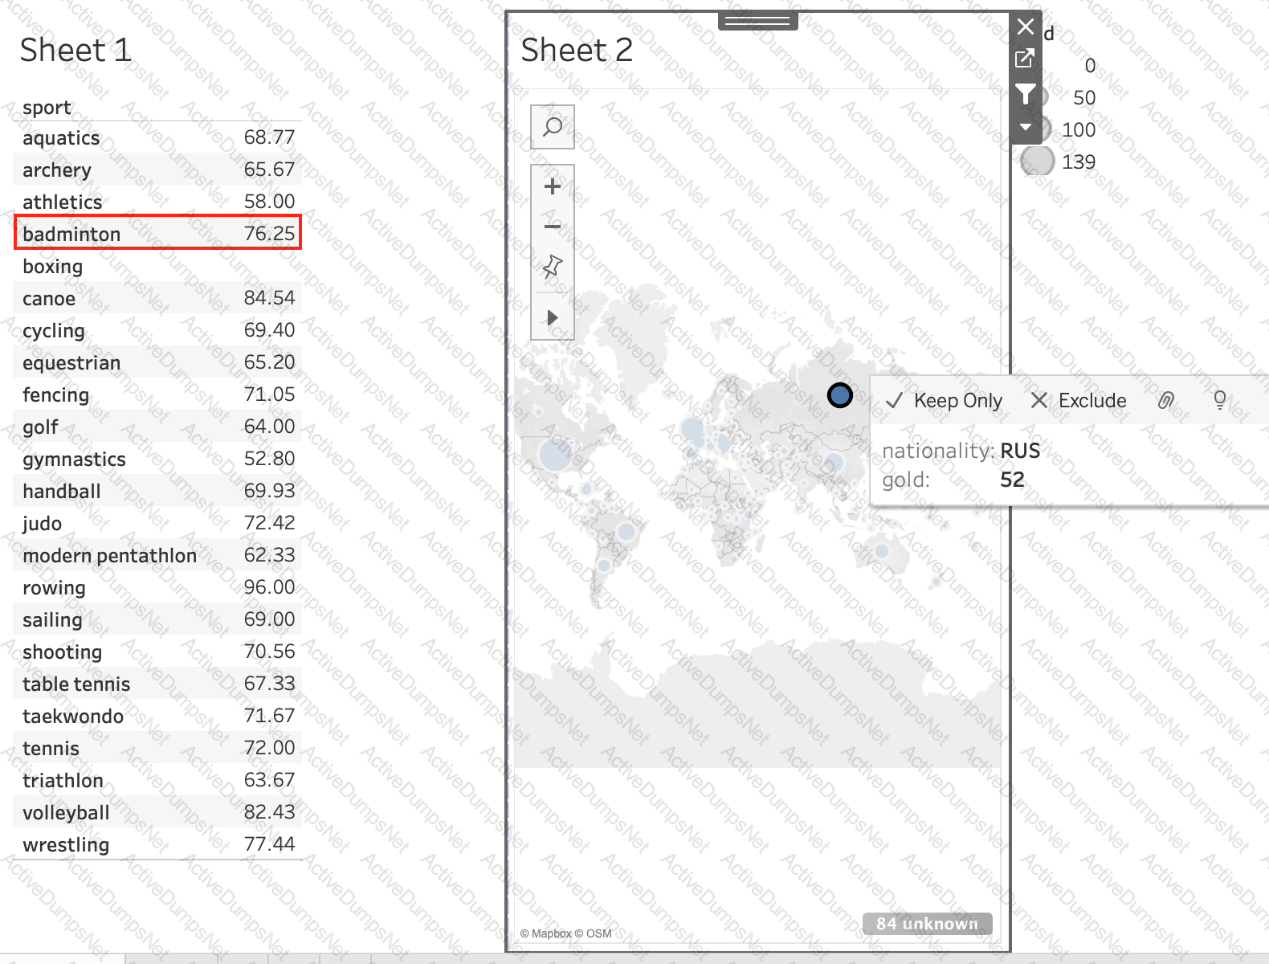
Using the atheletes table:
i) Create a sheet with a crosstab showing the Average weight for each sport (Sheet 1)
ii) Create a sheet with a Map showing the Total number of gold medals per Country. Use size as a Mark. (Sheet 2)
Now, Create a Dashboard containing both these sheets, and Use Sheet 2 as a Filter for Sheet 1. What was the average weight for Badminton in Russia?
(Ignore any nulls / unknowns)
Given a map, which of the following fields can be placed on Size,Shape,Detail,Color
True or False: Sets can be created on Measures
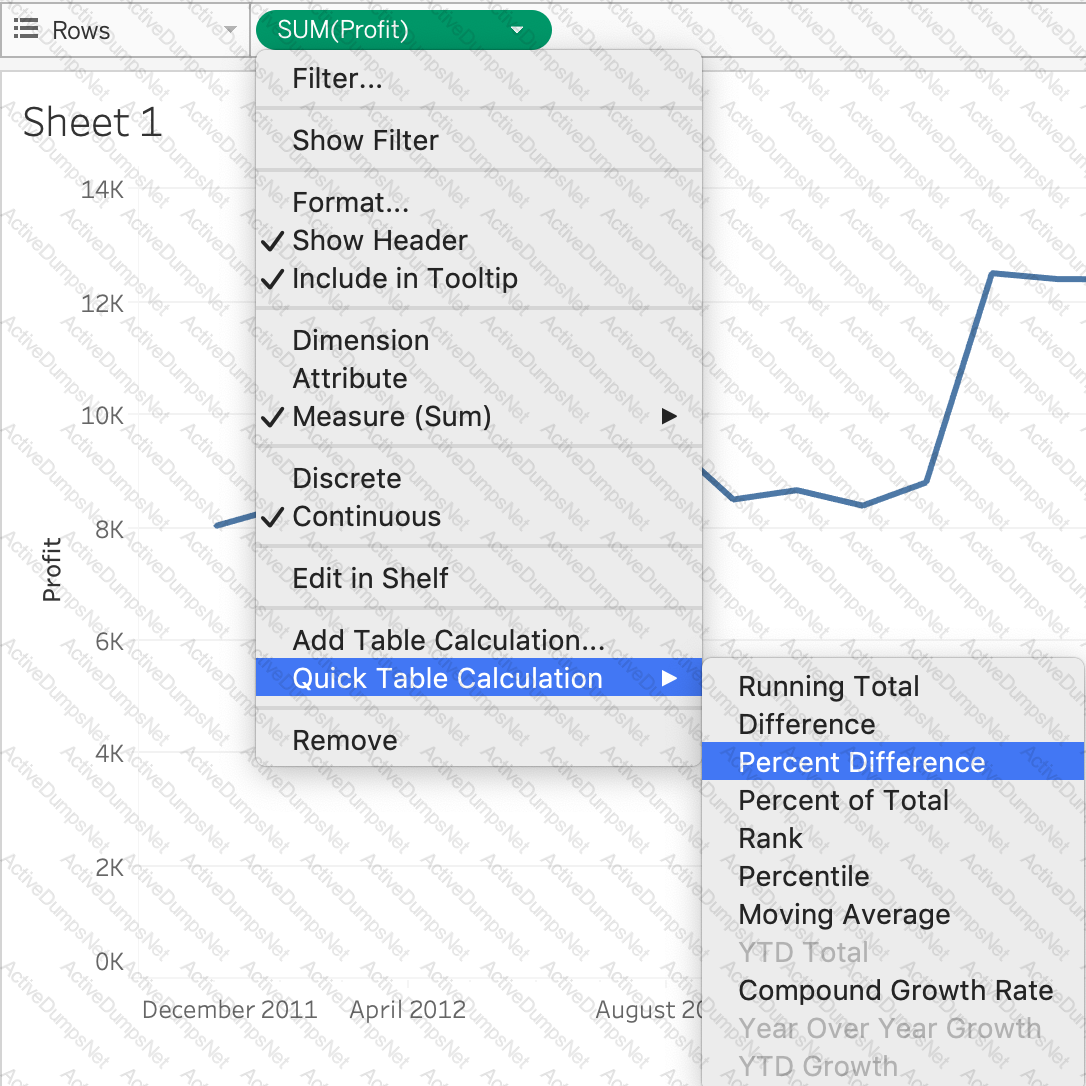
Using the CoffeeChain table, create a chart to see the monthly Percent difference change in Profit, from the beginning of 2012 to the end of 2013. How many months saw a Negative percent difference in Profit?
You have a bar chart that has a dimension on the Columns shelf and a measure on the Rows shelf.
How can you make a stacked bar chart?
When creating a date filter in Tableau, to what does Anchor refer?
What are three ways to access bolding options for the text in a tooltip? Choose three.
A _____________ action is a hyperlink that points to a web page, file, or other web-based resource outside of Tableau.
Which one of the following is a dimension?
What will the following function return?
LEFT("Tableau", 3)
________________ can only create header. _______________ will create header and axis both.
When is an axis created for the visualisation in Tableau?
While borders and background colors let you visually highlight items on a dashboard, _________ lets you precisely space items.
You have the following visualization.
You need to show how Internet Usage values change from year-to-year as a percentage. Which quick table calculation should you apply to the Internet Usage field?
The calculation [Ship Date] - [Order Date] will return _______________
Which of the following is true about 'Incremental refresh' when creating Extracts in Tableau?
Using the Time Series table, create a chart that shows the percent difference in Average Inventory on Hand for each Assortment by year and quarter.
How many quarters did the Electronics Assortment show a negative percent difference in the Average Inventory On Hand?
The row and column shelves contain ___________________
We can join a maximum of ______ tables in Tableau
You have a data set that builds a union between two tables. You need to extract the data set. What should you use to extract the data set?
________________ files are shortcuts for quickly connecting to the original data that you use often. Data source files do not contain the actual data but rather the information necessary to connect to the actual data as well as any modifications you've made on top of the actual data such as changing default properties, creating calculated fields, adding groups, and so on.
A union of two tables usually results in an
What is the minimum amount of RAM recommended for any production use of Tableau Server?
Is it possible to deploy a URL action on a dashboard object to open a Web Page within a dashboard rather than opening the system’s web browser?
Which two elements can have their values changed by using a dashboard action? Choose two.
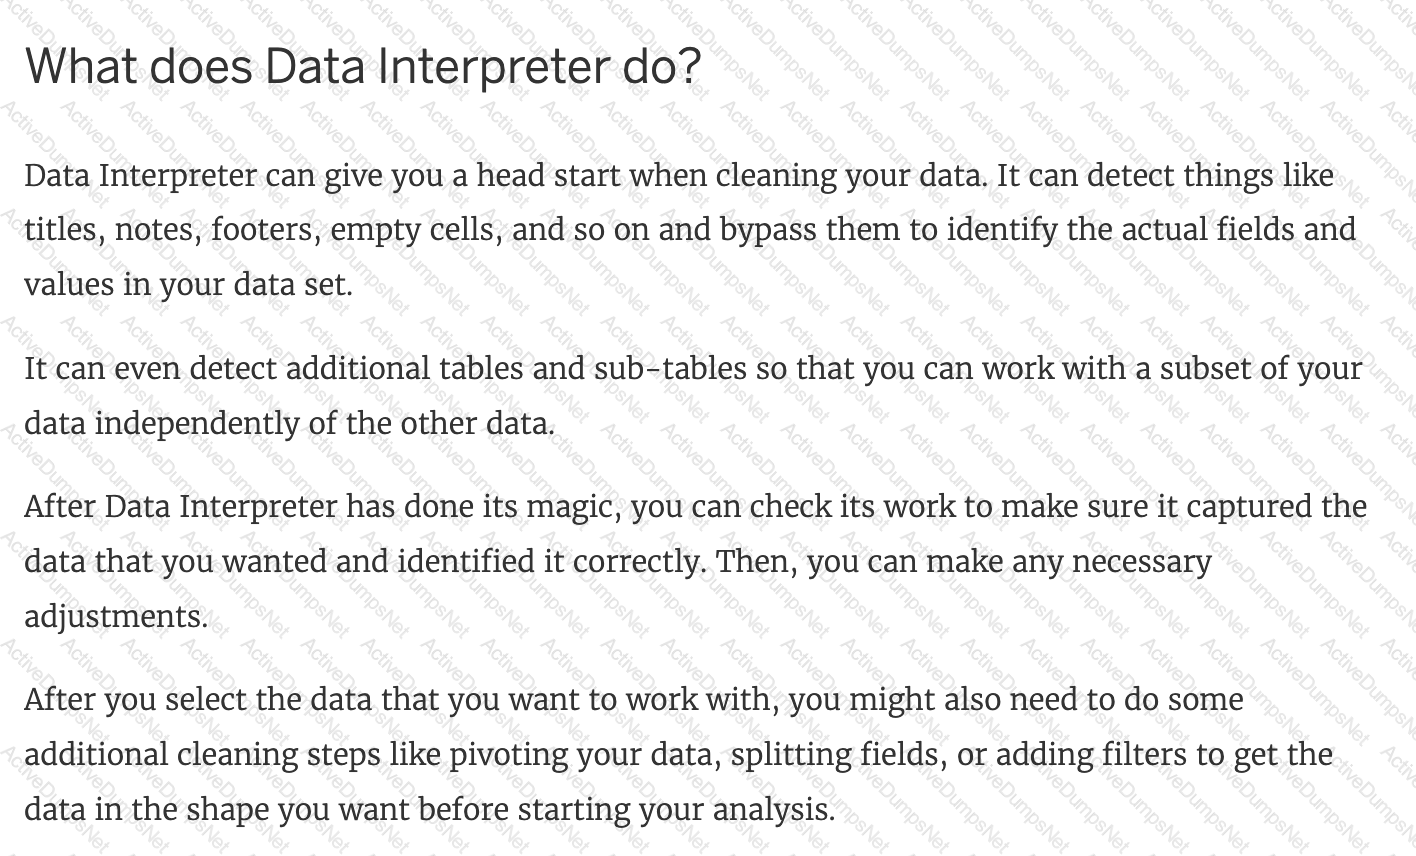
You can use the __________________ in Tableau to clean / organise your data.
What does the following marker/icon do in Tableau?
 Chart, bar chart
Description automatically generated
Chart, bar chart
Description automatically generatedYou view the relationship canvas shown in the following exhibit.
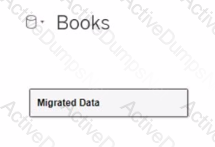
What does Migrated Data indicate?
The View Data window displays as much of the data as possible by default, up to _______________ rows.
Which mark type is used in a highlight table?
What are two benefits of using a live connection to a data source as compared to an extract? Choose two.
Which of the following are interactive elements that can be added to a dashboard for users?
If you decide you want to see all of the marks in the view at the most detailed level of granularity, you can __________________ the view.
In which situation should you save a workbook as a PDF document?
Which of the following charts types always includes bars sorted in descending order?
True or False: To concatenate fields, they must be of same data type
Which of the following are benefits of combining sheets using dashboards?
Is it possible to make a Measure discrete?
With the Marks card drop-down menu set to Automatic, a line chart will be created whenever you place what on the Rows shelf and the Columns shelf?
True or False: Trend lines can only be used with numeric or date fields
What are three options to change the scope of a reference line? Choose three.
How can you MANUALLY assign geographic roles to a dimension from the data pane?
Which type of filter affects a fixed Level of Detail (LOD) expression?
What do the colours Blue and Green represent in Tableau?
Broadly speaking, after an importing a dataset in Tableau Desktop, all fields in it are broken down into _______________________
Which statement accurately describes an extract when the Physical Tables option is selected?
Which of the following fields would be best used as Dimensions?
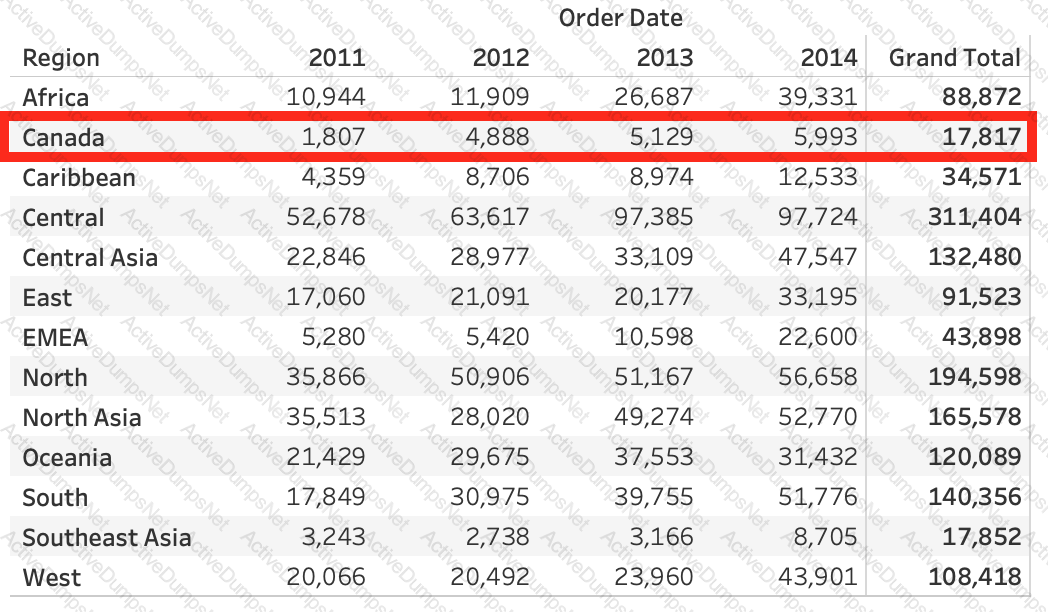
Using the dataset provided, create a crosstab showing the Profit of each Region per Year, then add grand totals to the view. What was the total Profit for Canada in 2012 and the total Profit for Canada for 2011 through 2014, respectively?
Which of the following returns the Absolute Value of a given number?
Which of the following are valid ways to trigger actions for a Dashboard?
Which three elements are included in a packaged workbook (.twbx)? Choose three.
You have a visualization that uses multiple types of sorting.
How can you clear all sorting of the visualization?
What term is used to describe the following picture?

At a minimum, what do you need to create a simple scatter plot?
DOWNLOAD THE DATASET FROM: https://drive.google.com/drive/folders/1WXzqsrNmXVdmQ-574wld4InEplyKT8RP?usp=sharing (if you haven't already)
Using the cwurData table, plot a Map to see which country had the Second highest number of patents in the Year 2013?
Which Sub-Category had the least Profit in the Office Supplies category?