Tableau Desktop-Specialist Tableau Desktop Specialist Exam Exam Practice Test
Tableau Desktop Specialist Exam Questions and Answers
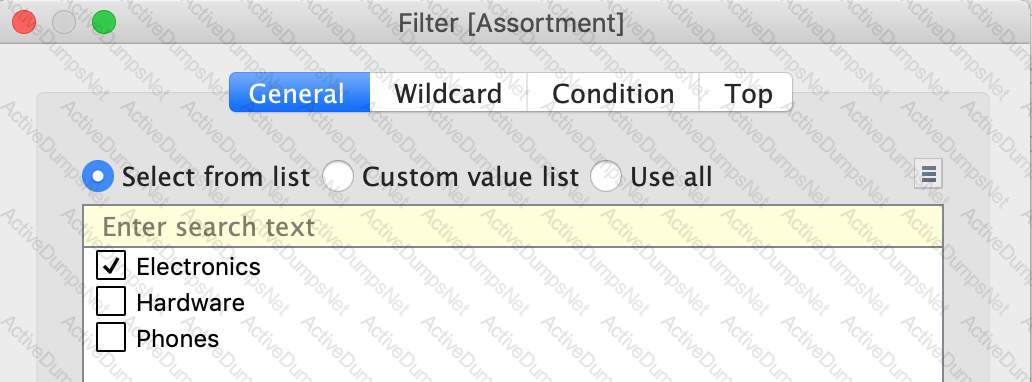
Which of the following would you use to connect to multiple tables in a single data source at once?
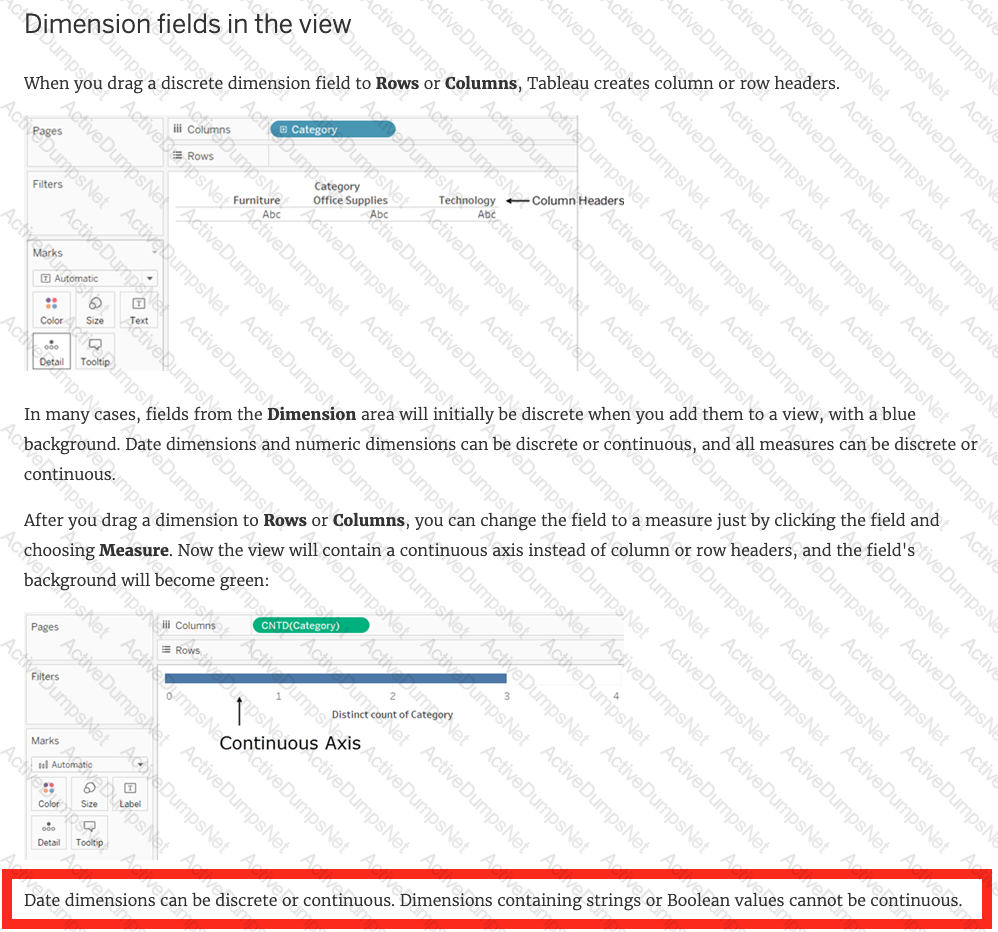
Dimensions containing ____________ and ____________ values cannot be continuous.
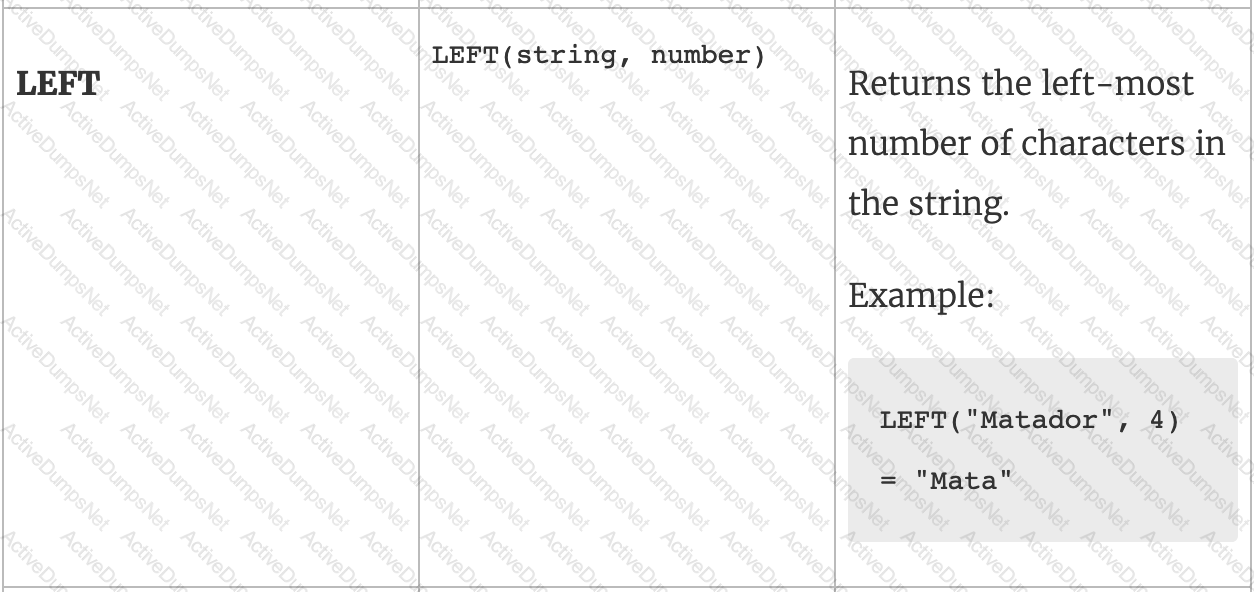
What will the following function return?
LEFT("Tableau", 3)
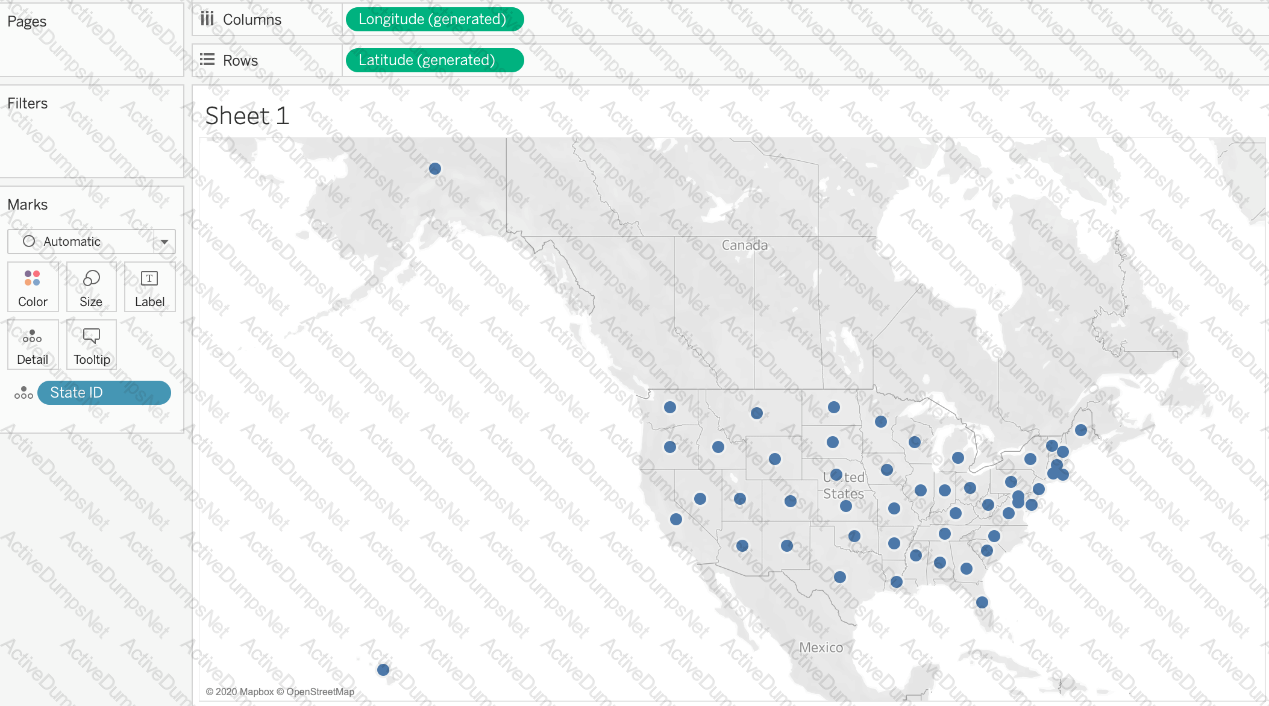
Given a map, which of the following fields can be placed in Size,Shape,Detail,Color
How can you set the default properties of a field to Currency?
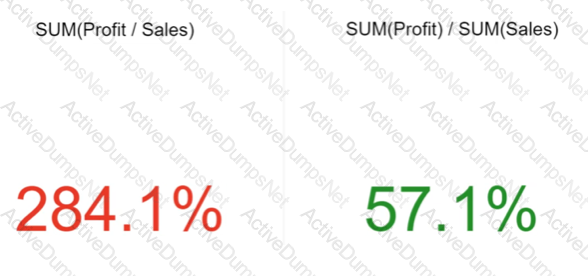
What is created by a calculated field that has a formula of SUM(Sales)/SUM(Profit)?
You need to create a calculation that returns a customer name followed by a comma, a space, and then the customer's age (for example: John Doe, 32).
What should you include in the calculation?
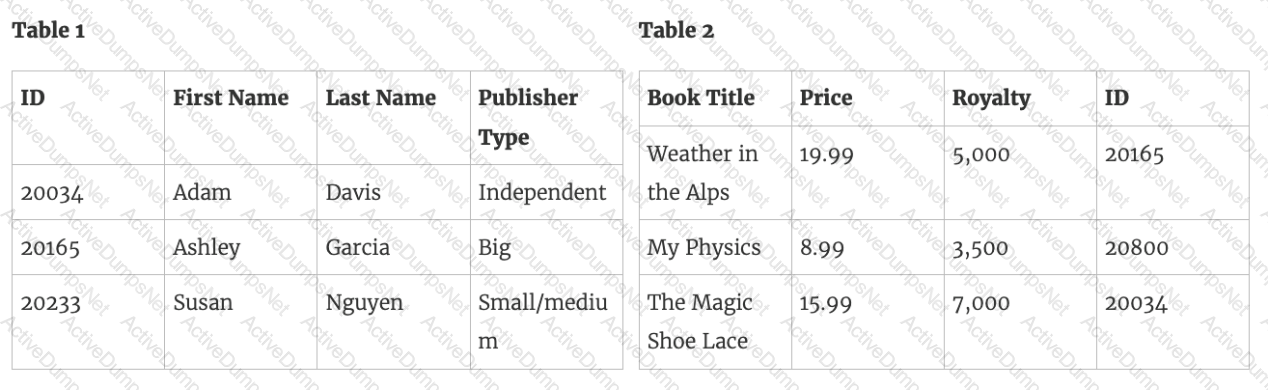
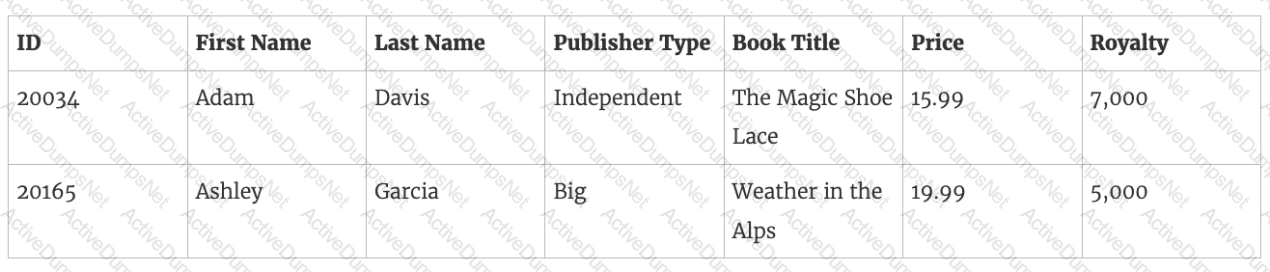
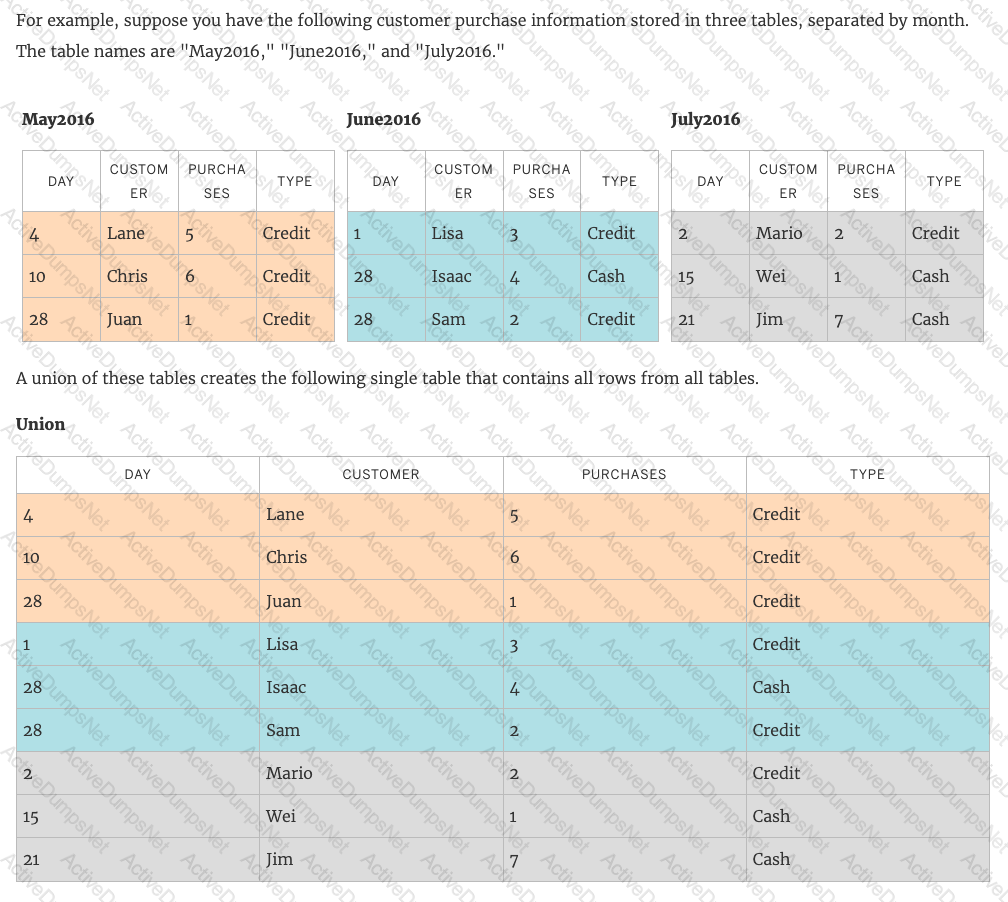
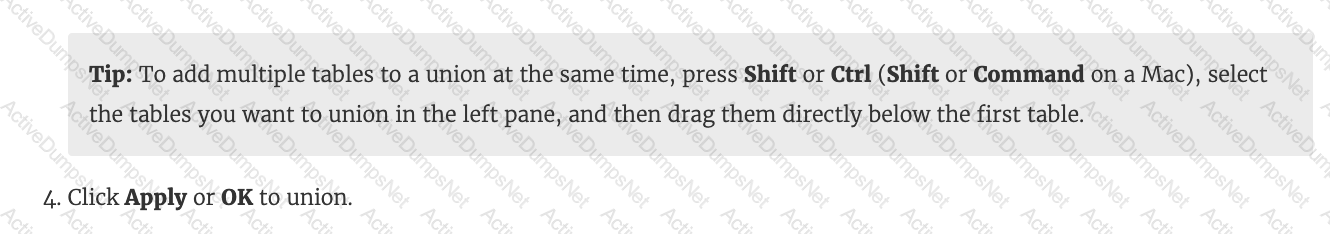
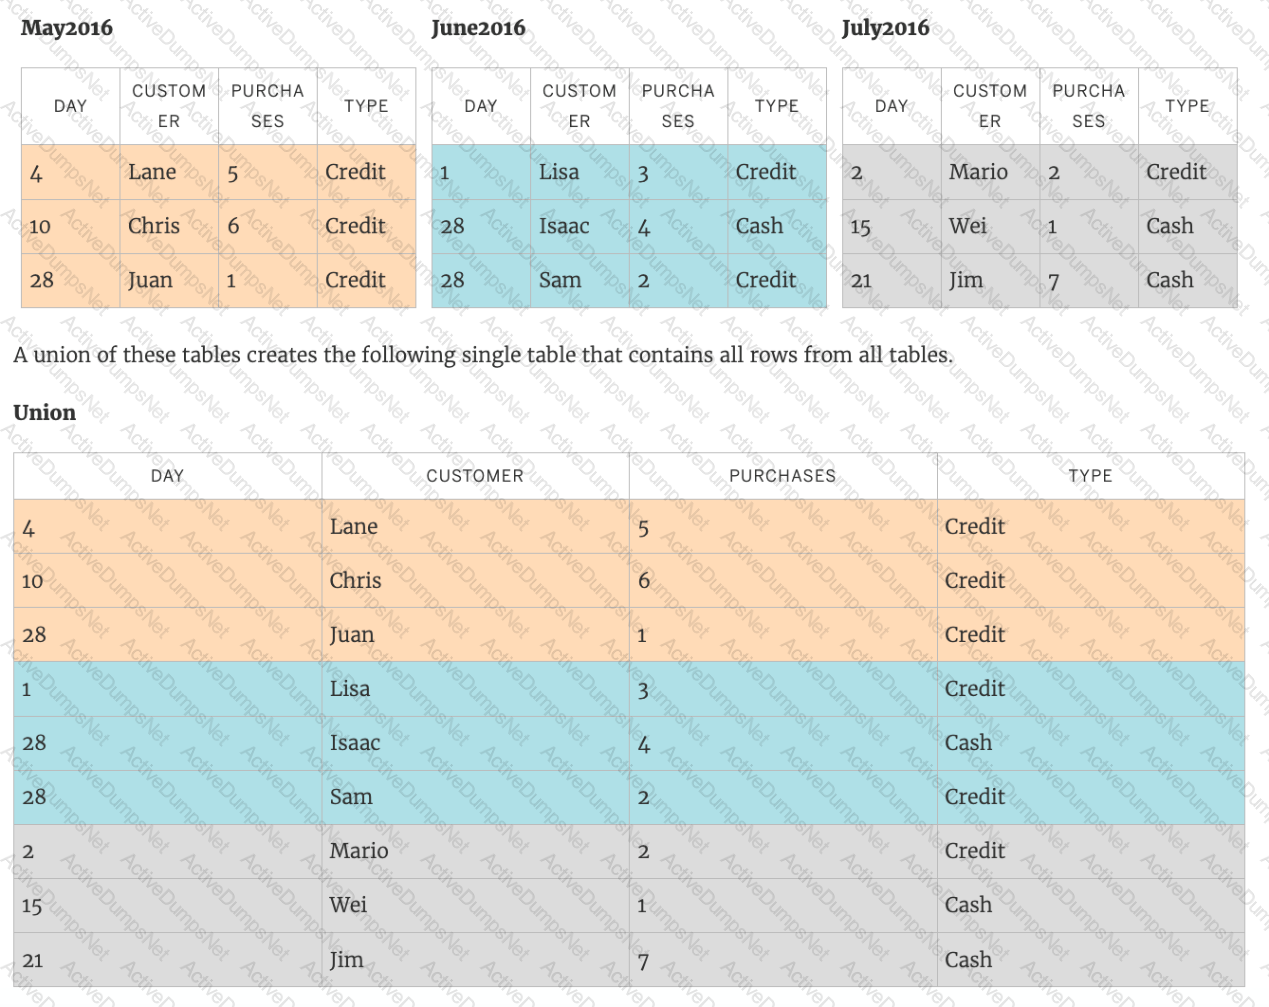
A union of two tables usually results in an
 Graphical user interface, text
Description automatically generated
Graphical user interface, text
Description automatically generatedFor which of the following charts, does the Size option on the Marks card not work?
True or False: We can disaggregate the data, to see all of the marks in the view at the most detailed level of granularity
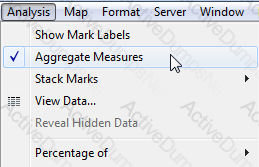
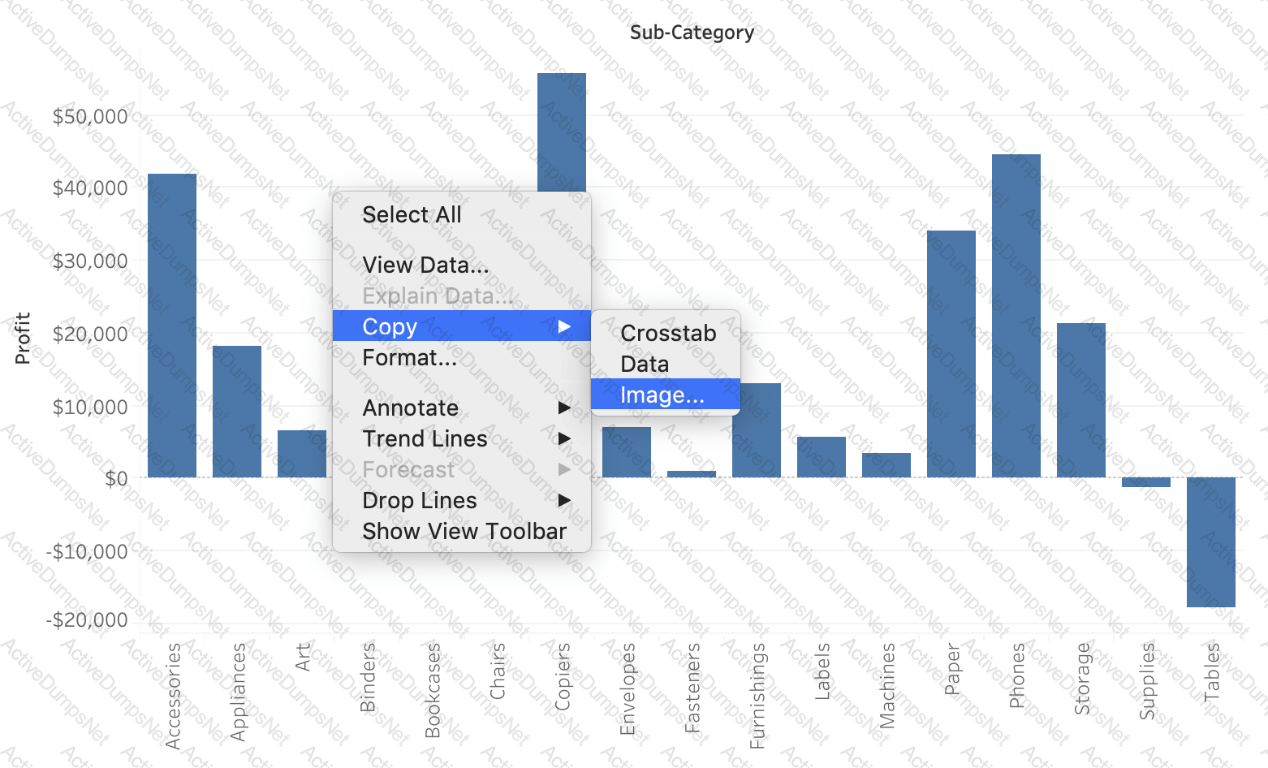
Which of the following are valid ways to copy a worksheet visualisation as an image?
When using a data source that has relationships, how can you add a join between two or more tables?
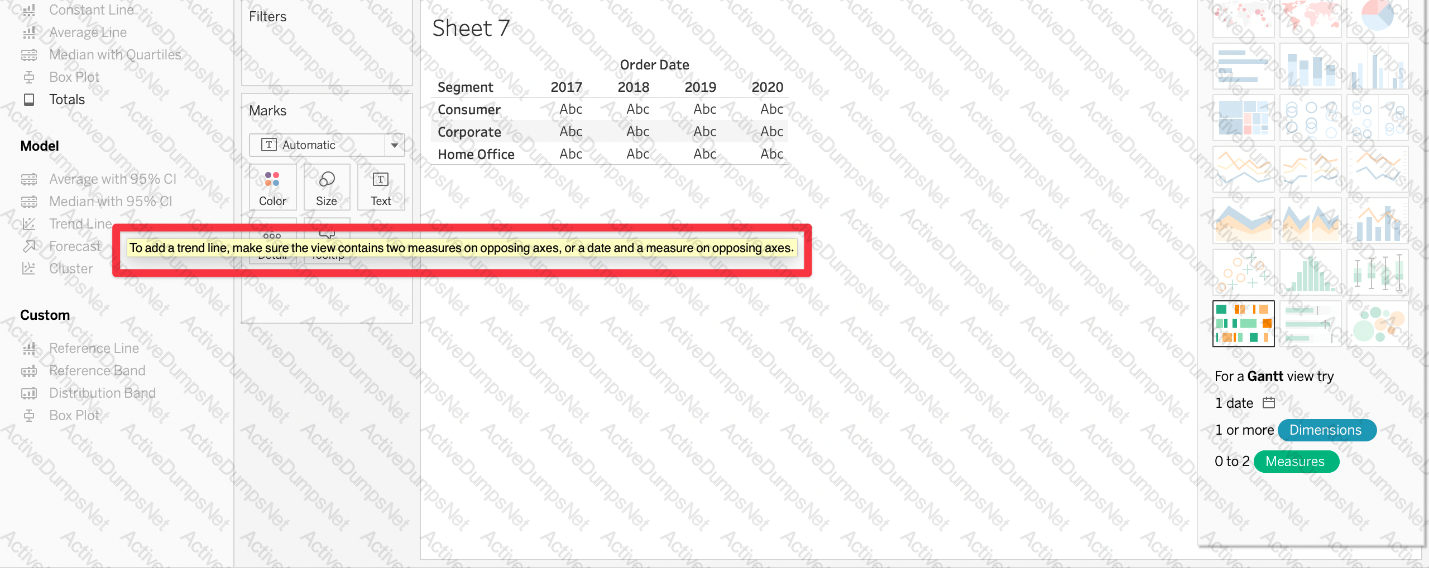
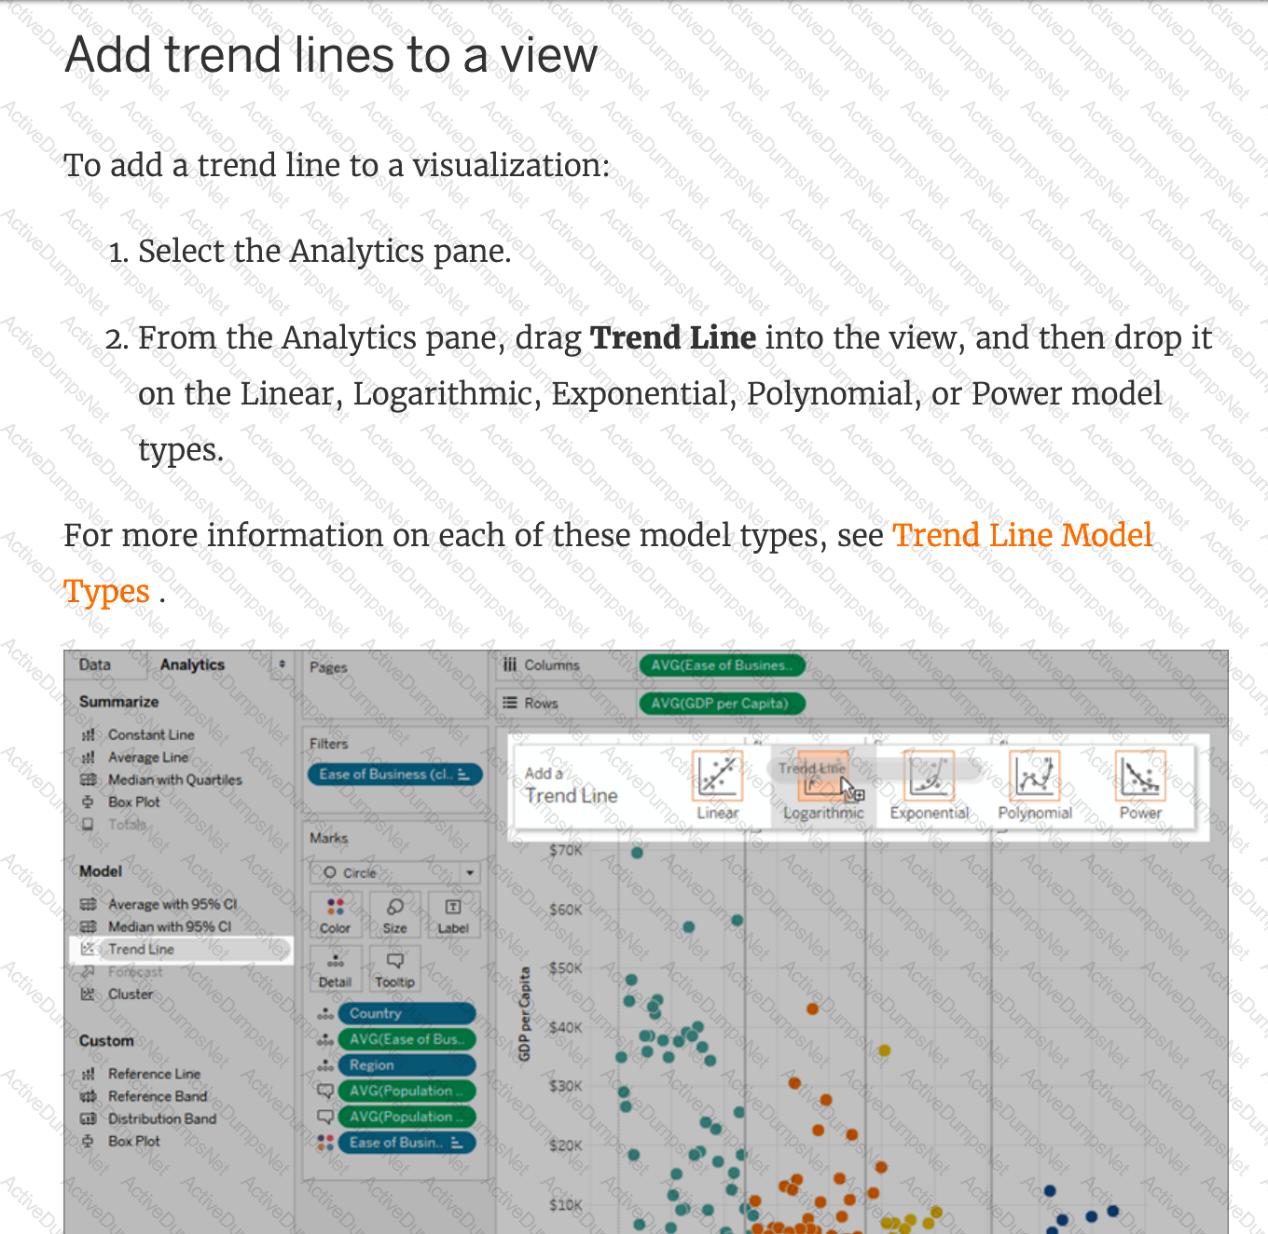
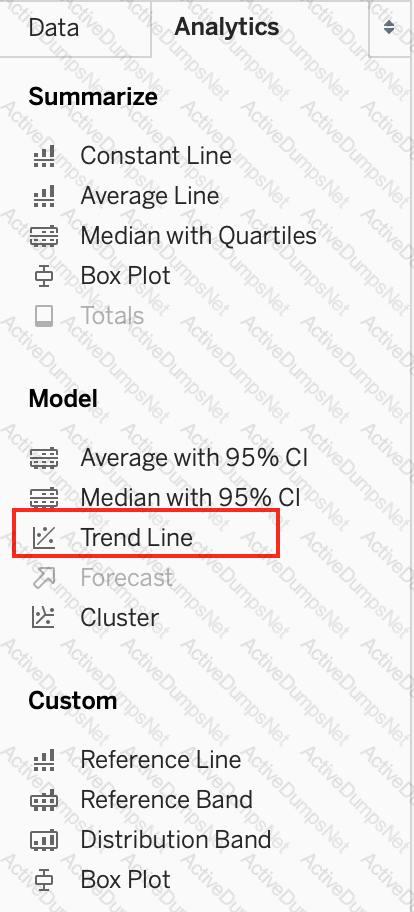
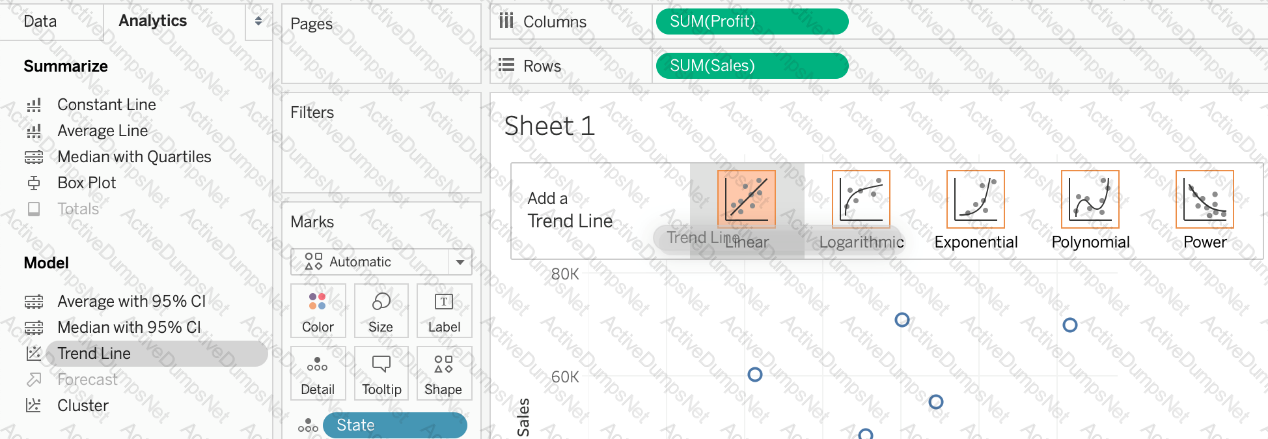
Which of the following are required to create a trend line?
 Graphical user interface, application
Description automatically generated
Graphical user interface, application
Description automatically generatedWhich of the following is not a Trend Line Model?
Creating a scatter plot requires a minimum of how many measures?
 ( Simple Scatter Plot)
 (Matrix of Scatter Plots)
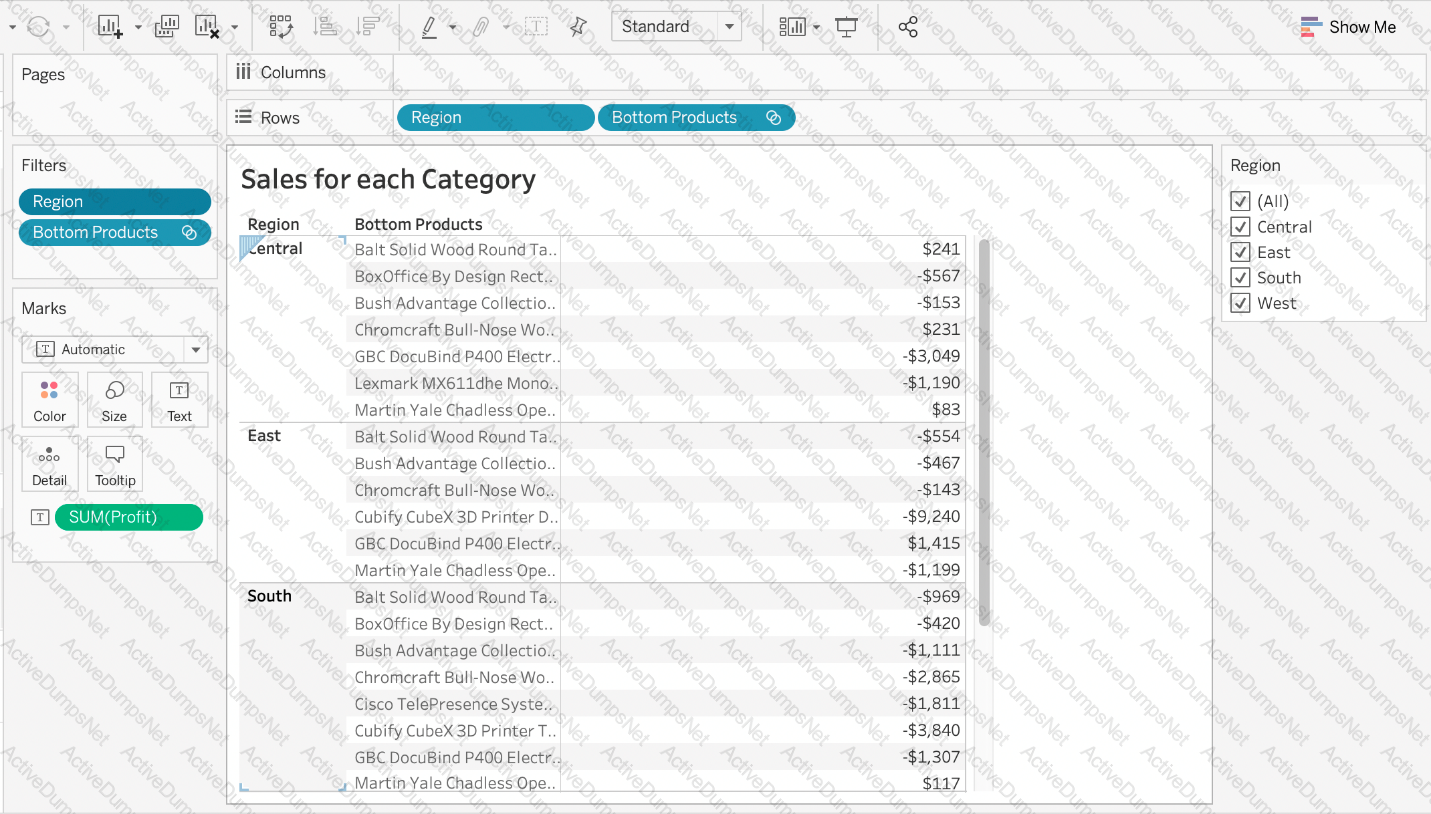
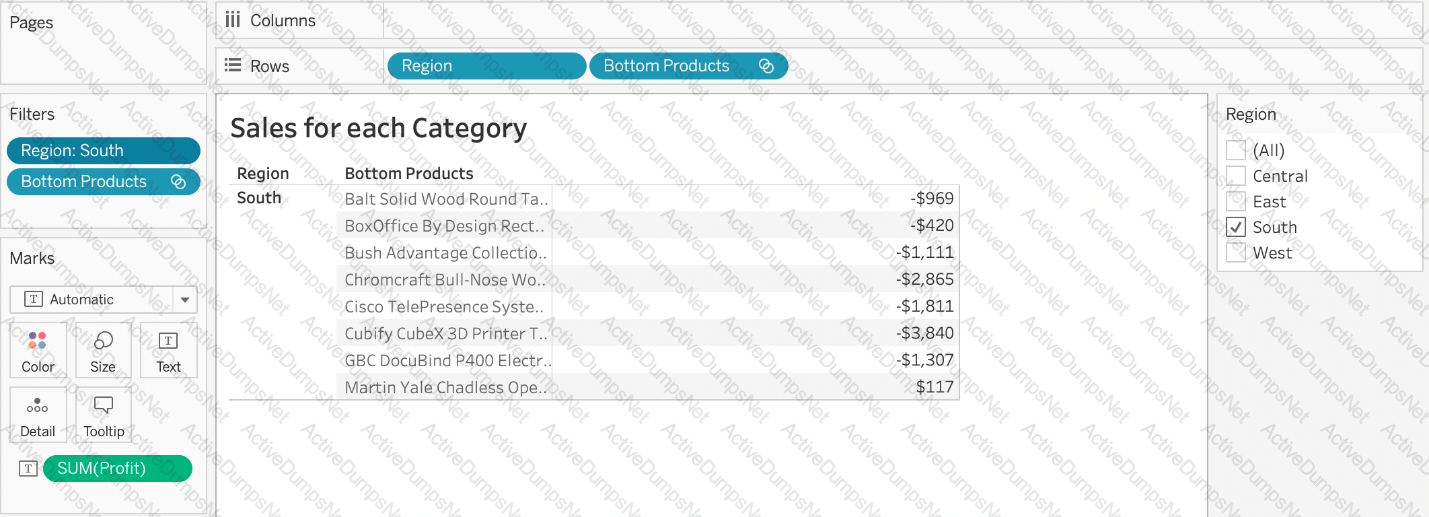
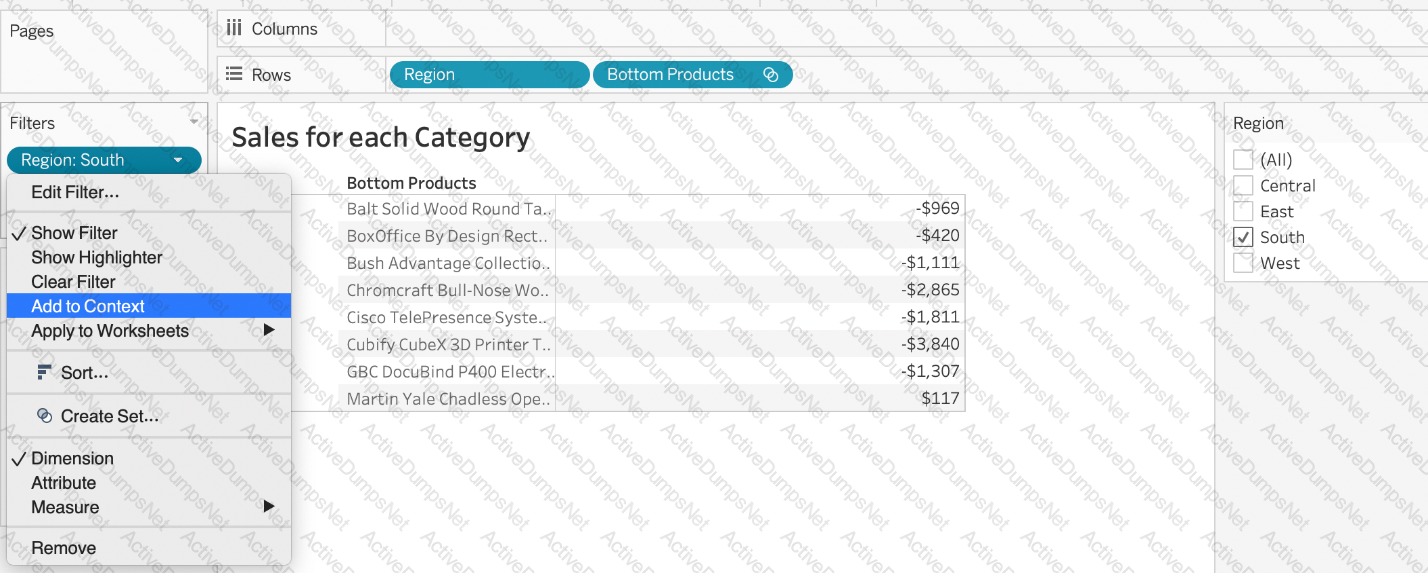
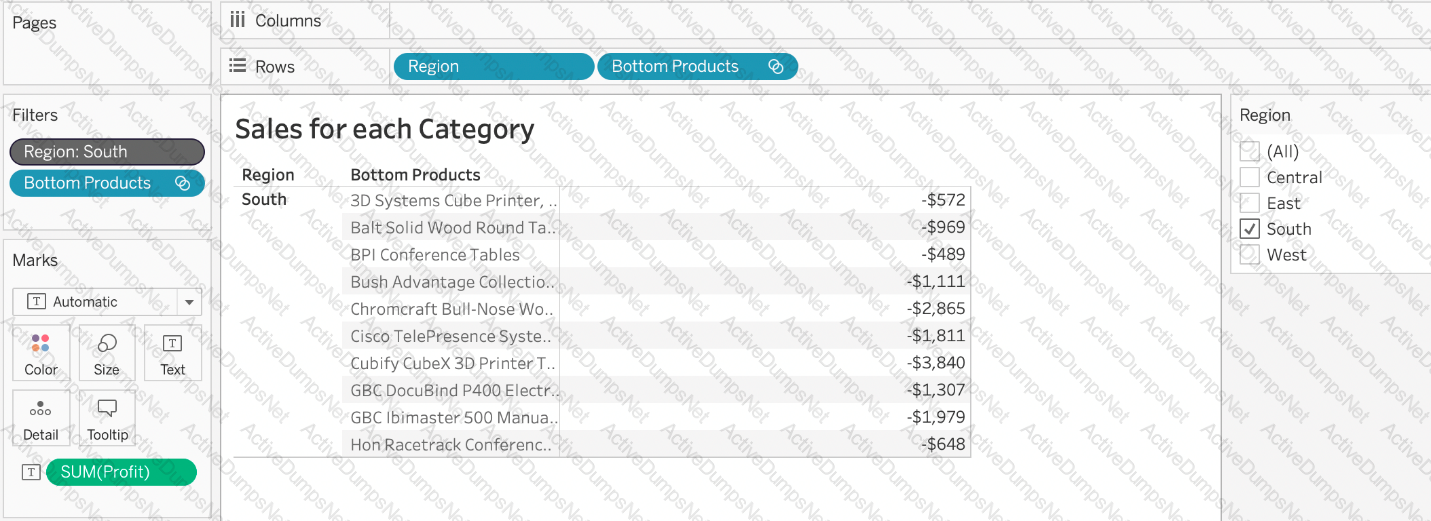
Our use case states that we need to create a set showing the Bottom 10 products by Profit in each Region. Which of the following filter types should you apply on Region?
 Diagram
Description automatically generated
Diagram
Description automatically generated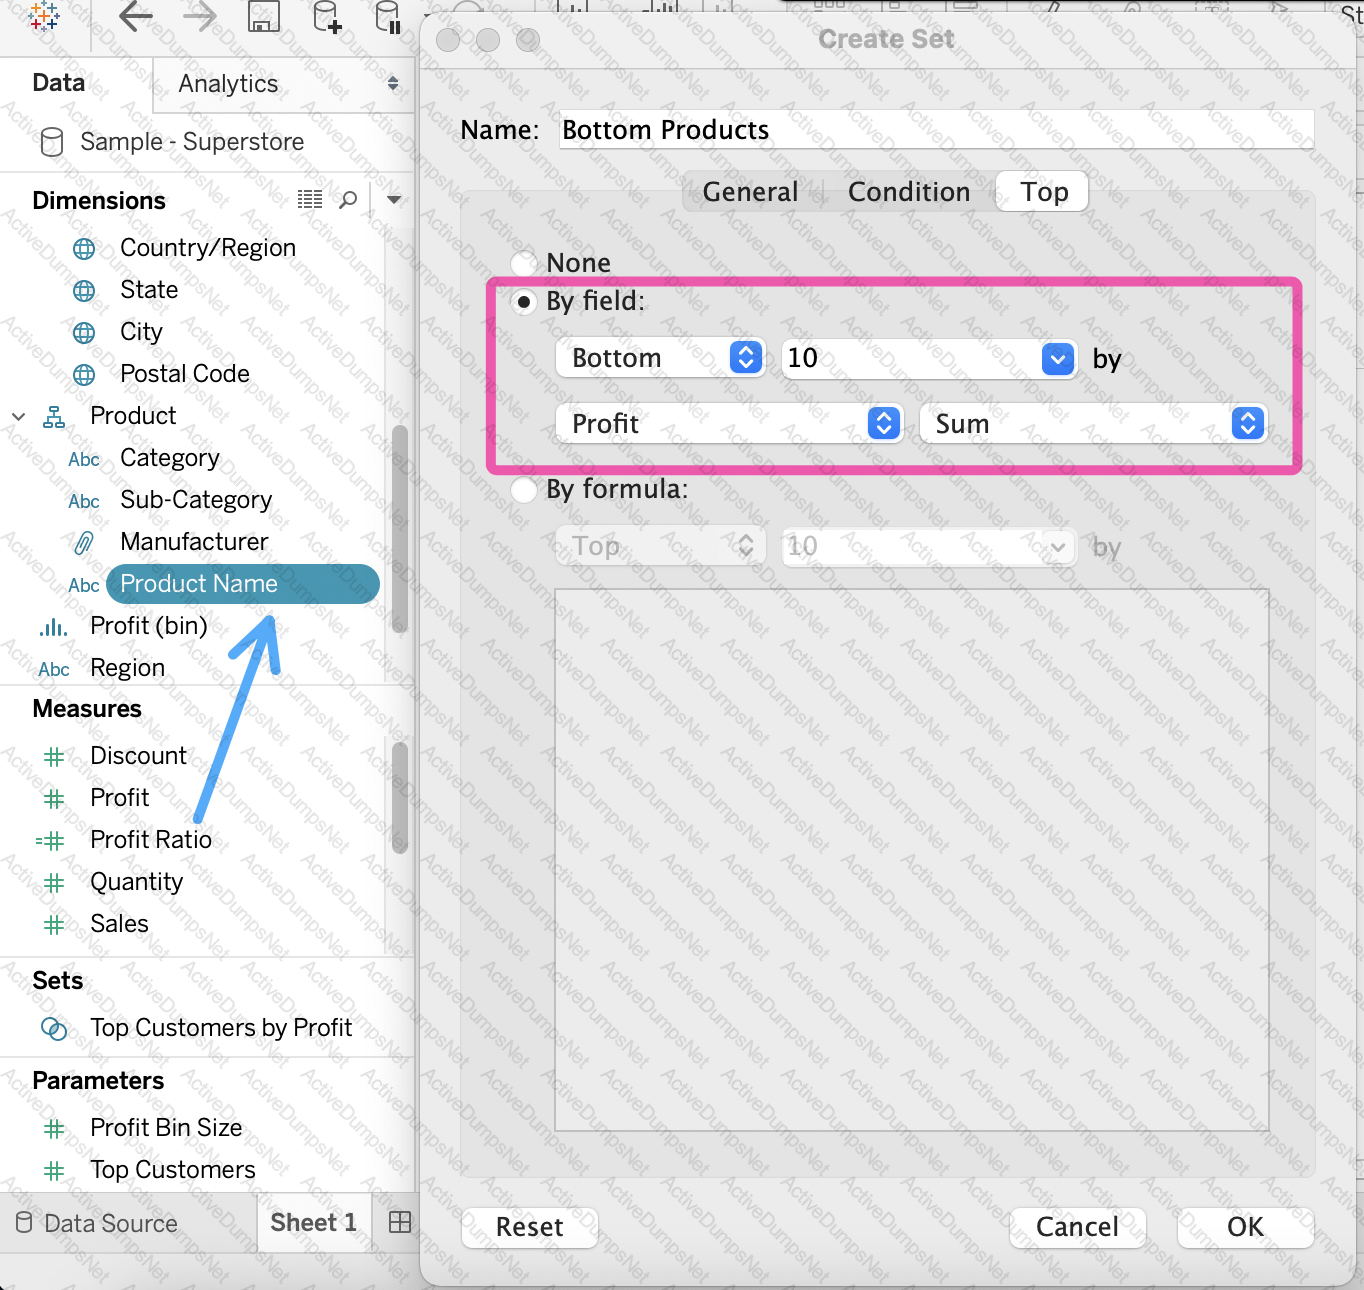
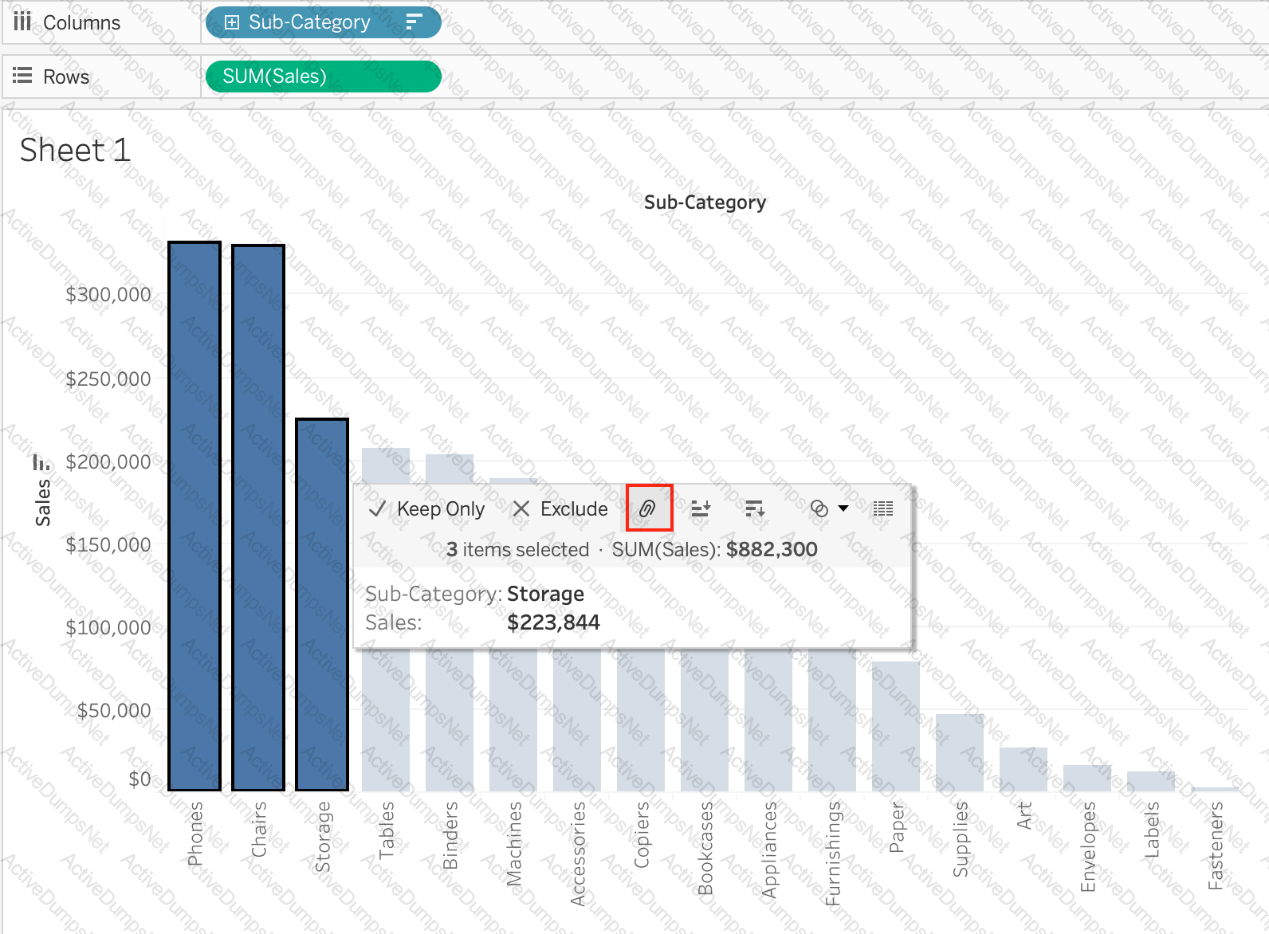
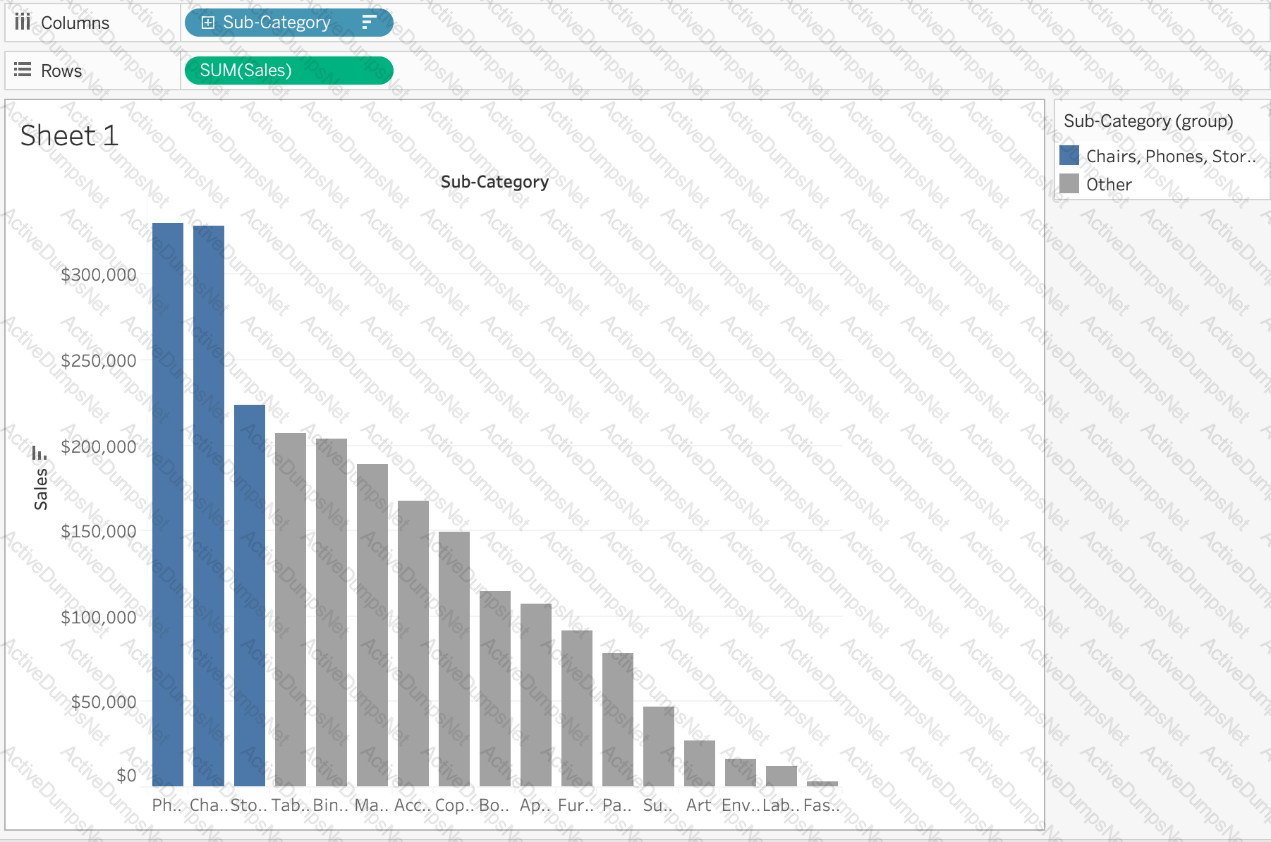
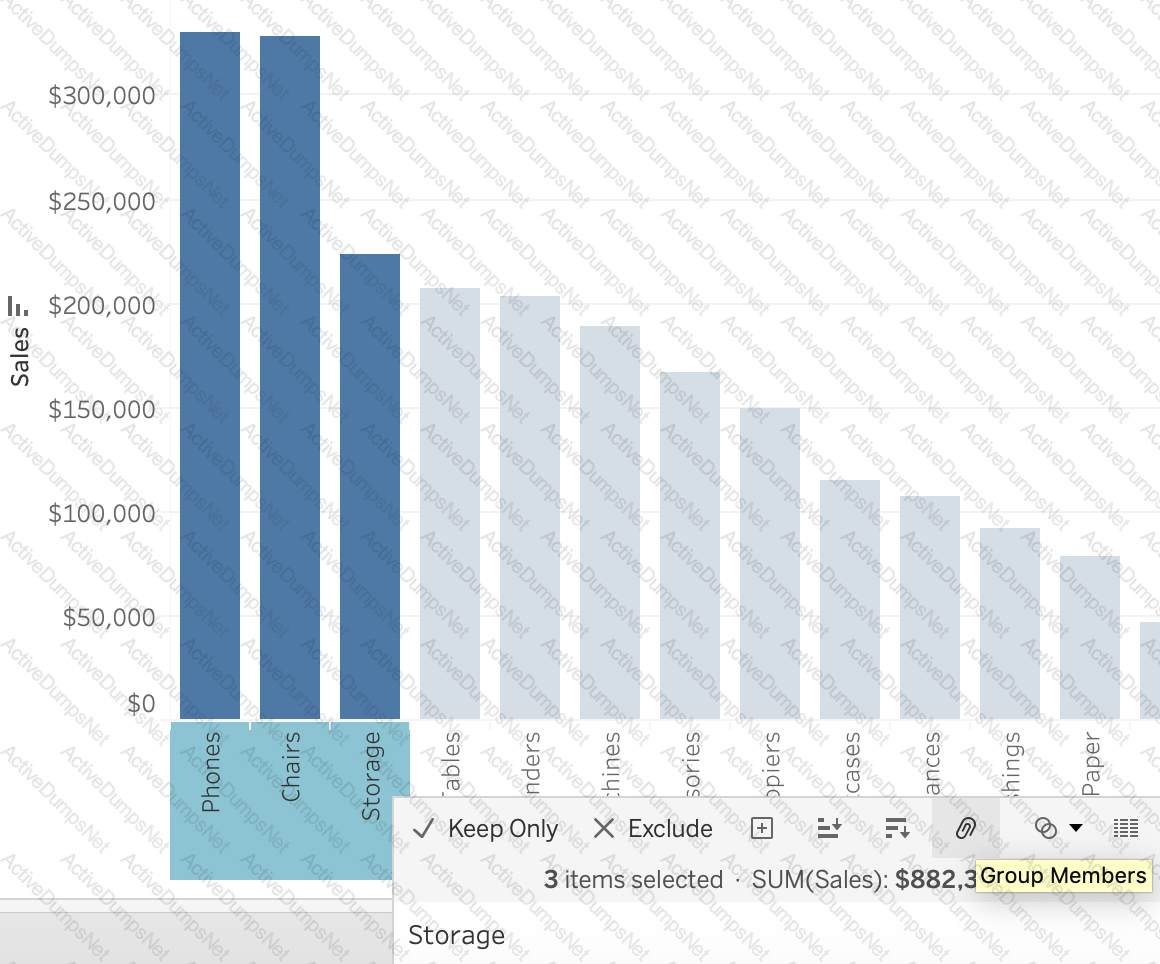
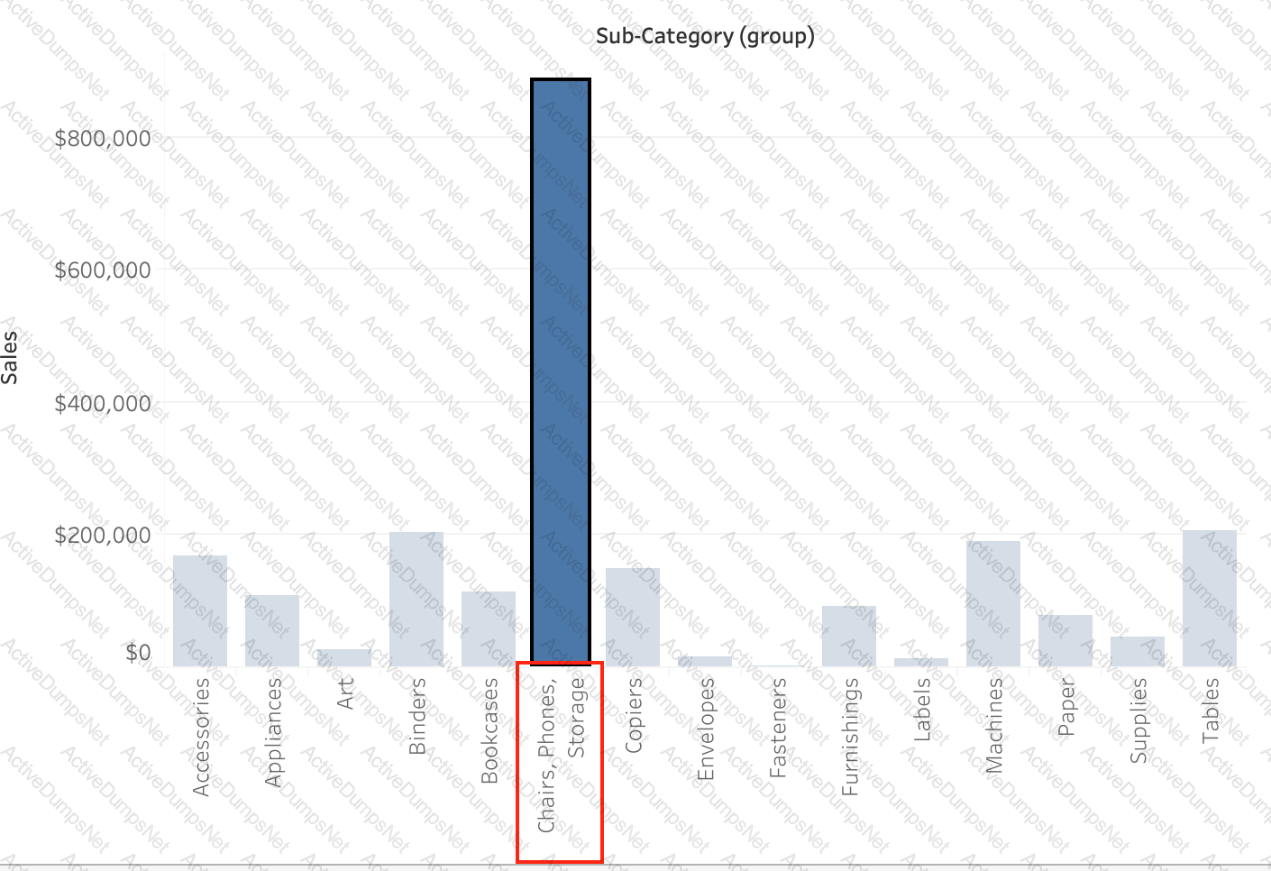
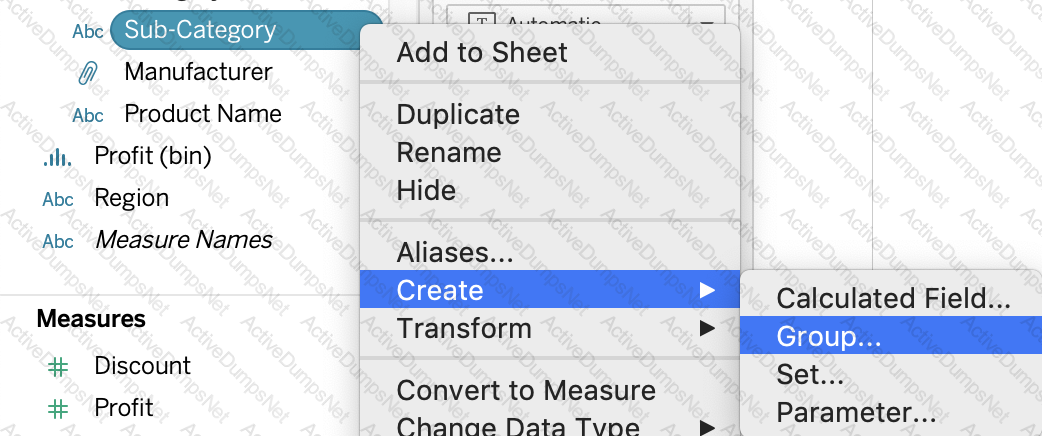
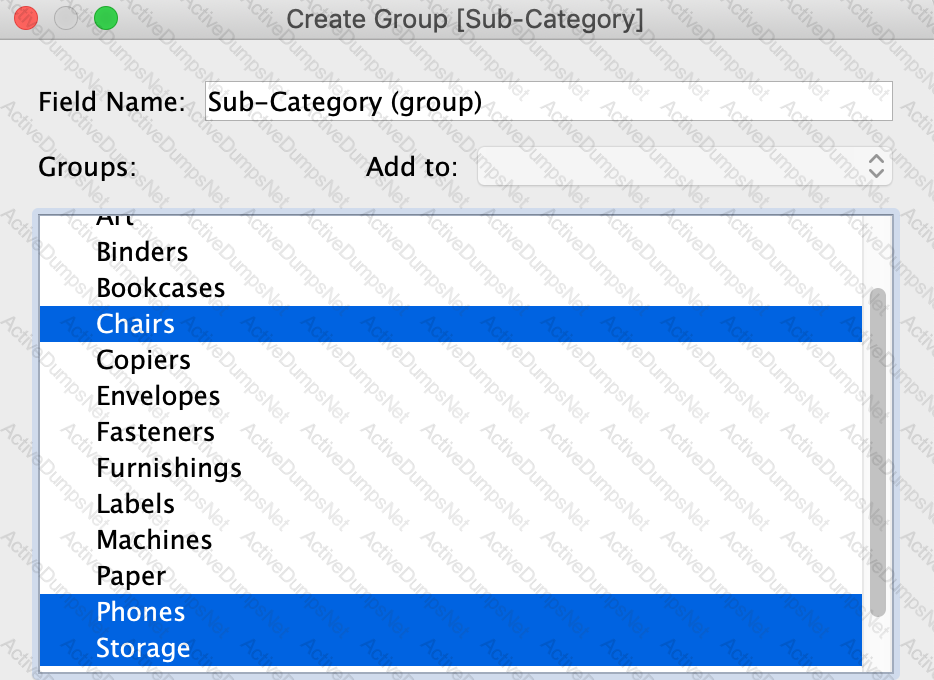
Which statement accurately describes creating a group by selecting headers in a view?
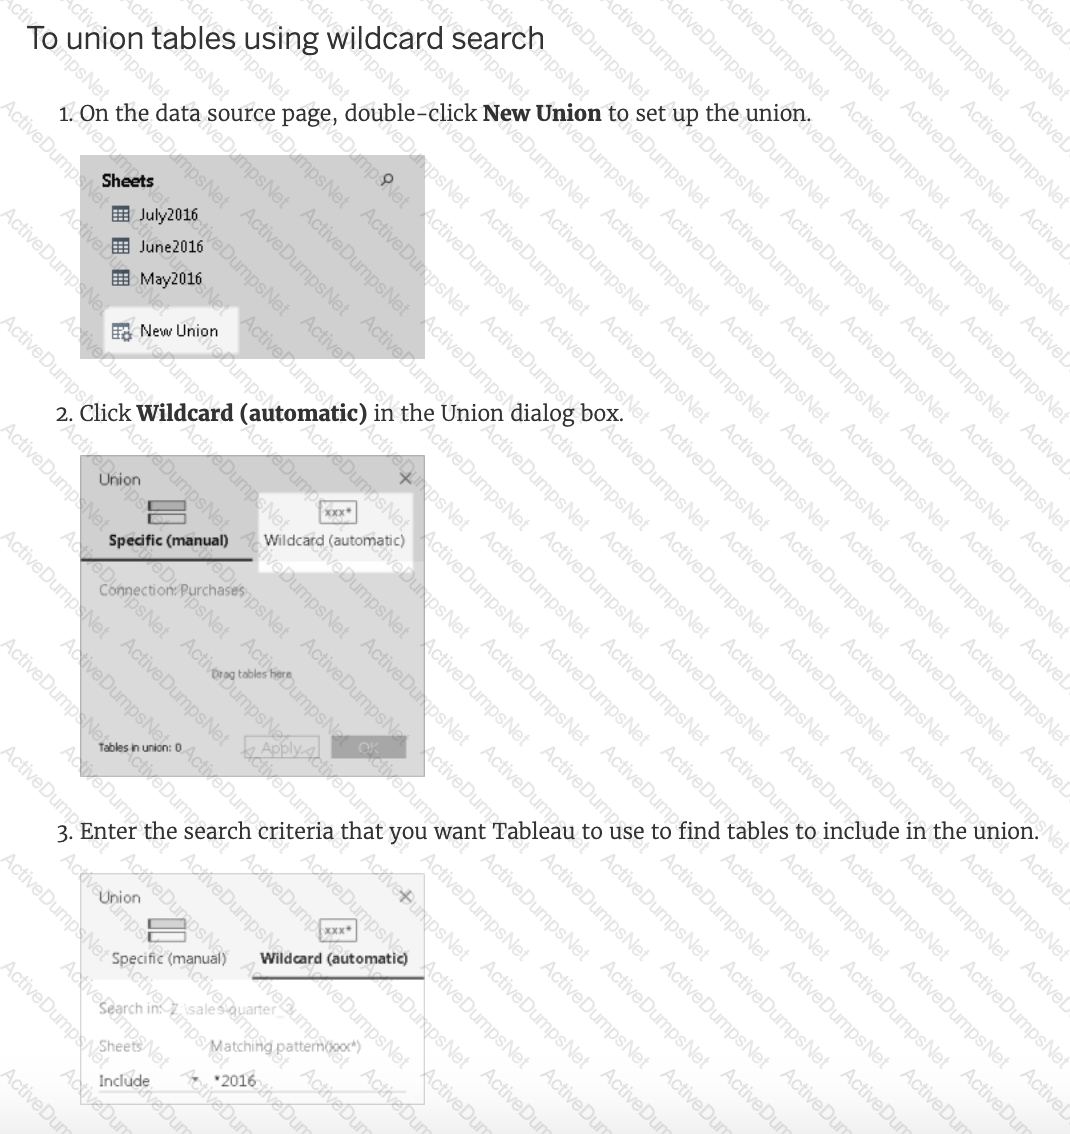
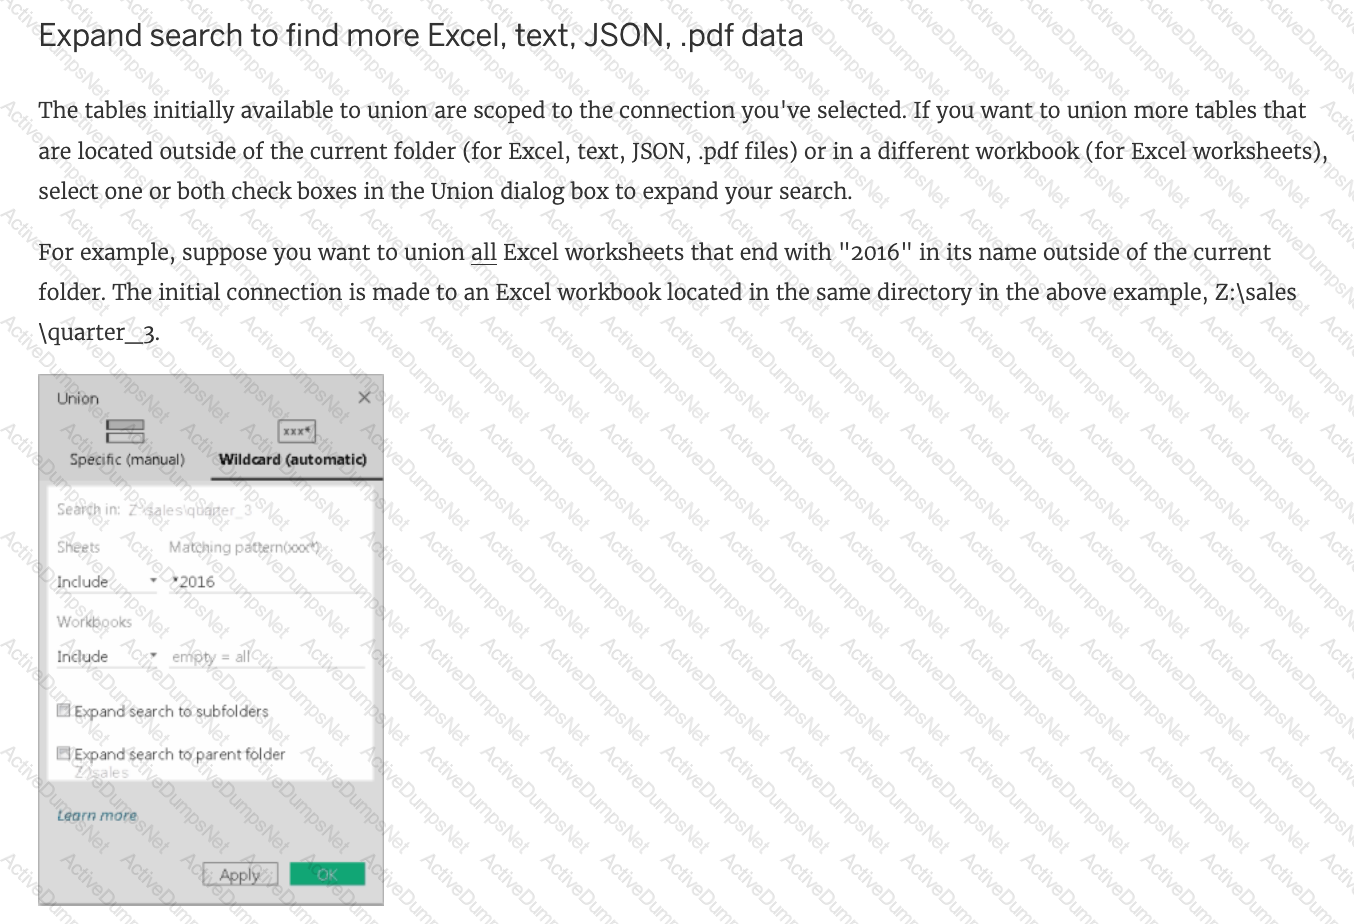
When working with Excel, text file data, JSON file, .pdf file data, you can use _________________ to union files across folders, and worksheets across workbooks. Search is scoped to the selected connection.
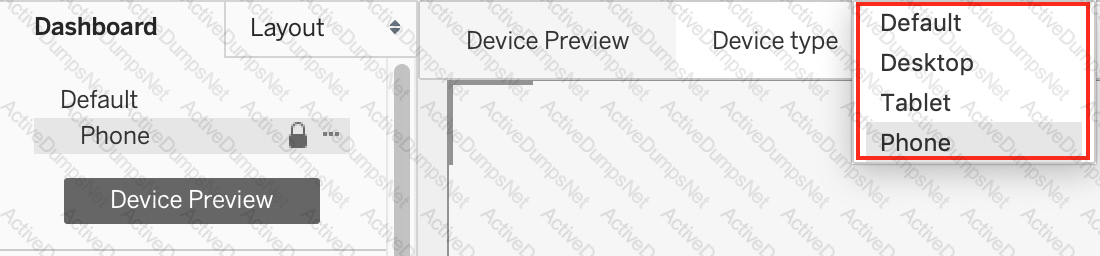
When creating a dashboard for multiple devices, which of the following Device options are available in the Device Preview section?
 Graphical user interface
Description automatically generated
Graphical user interface
Description automatically generatedWhich type of date filter can you use to choose a range of dates based on TODAY ()?
_______________ enables us to create workbooks and views, dashboards, and data sources in Tableau Desktop, and then publish this content to our own server.
You have a continuous numeric measure named Sales.
Which chart type is created when you double-click the Sales measure?
Which of the following charts types always includes bars sorted in descending order?
Which two elements can have their values changed by using a dashboard action? Choose two.
Which of the following is NOT a new feature introduced in Tableau 2020.1?
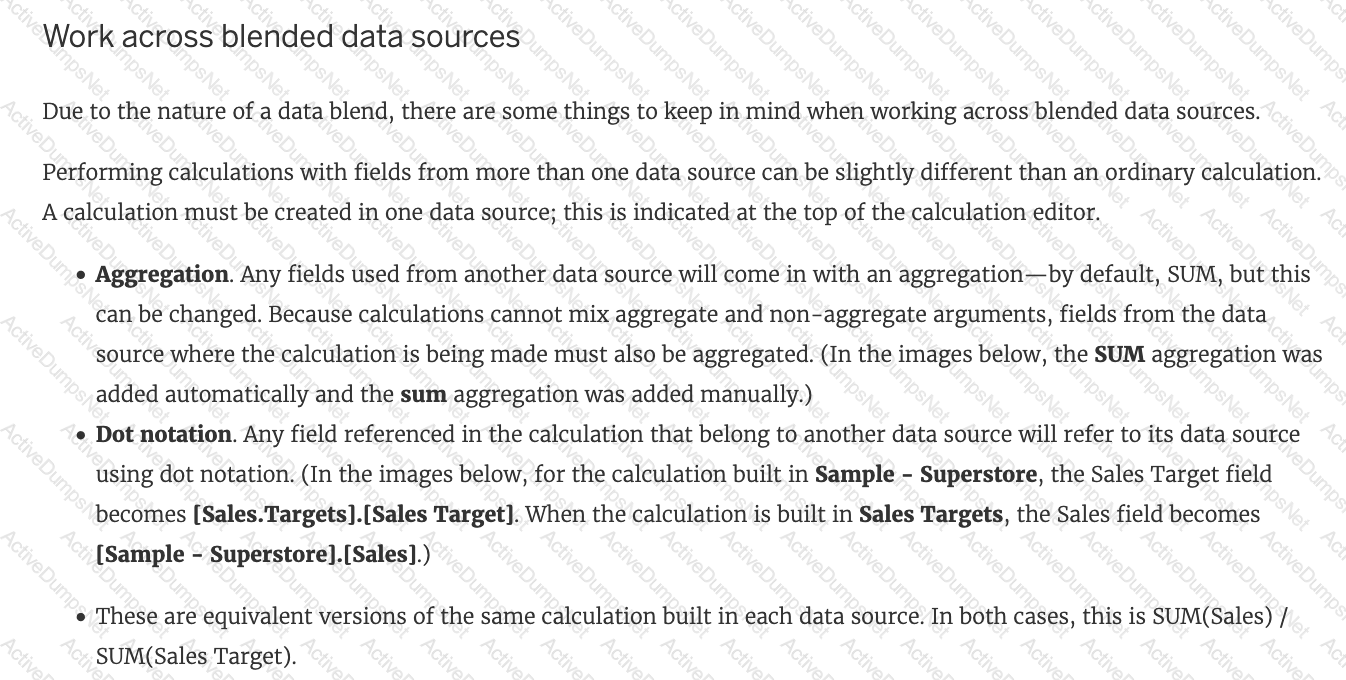
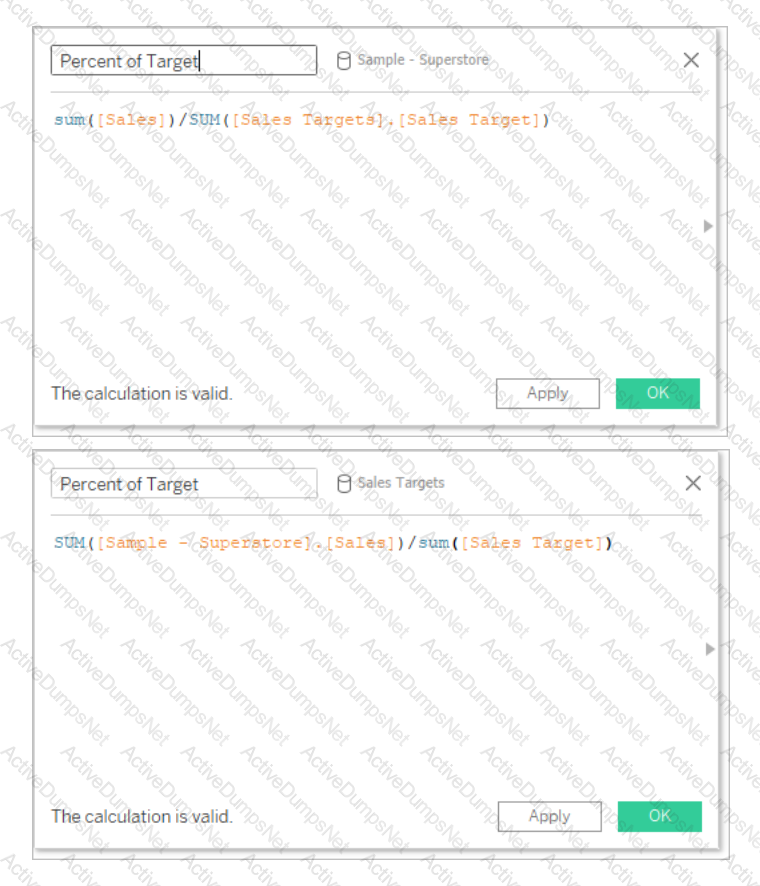
What is the one critical difference between normal calculated fields, and the calculated fields created after Data blending?
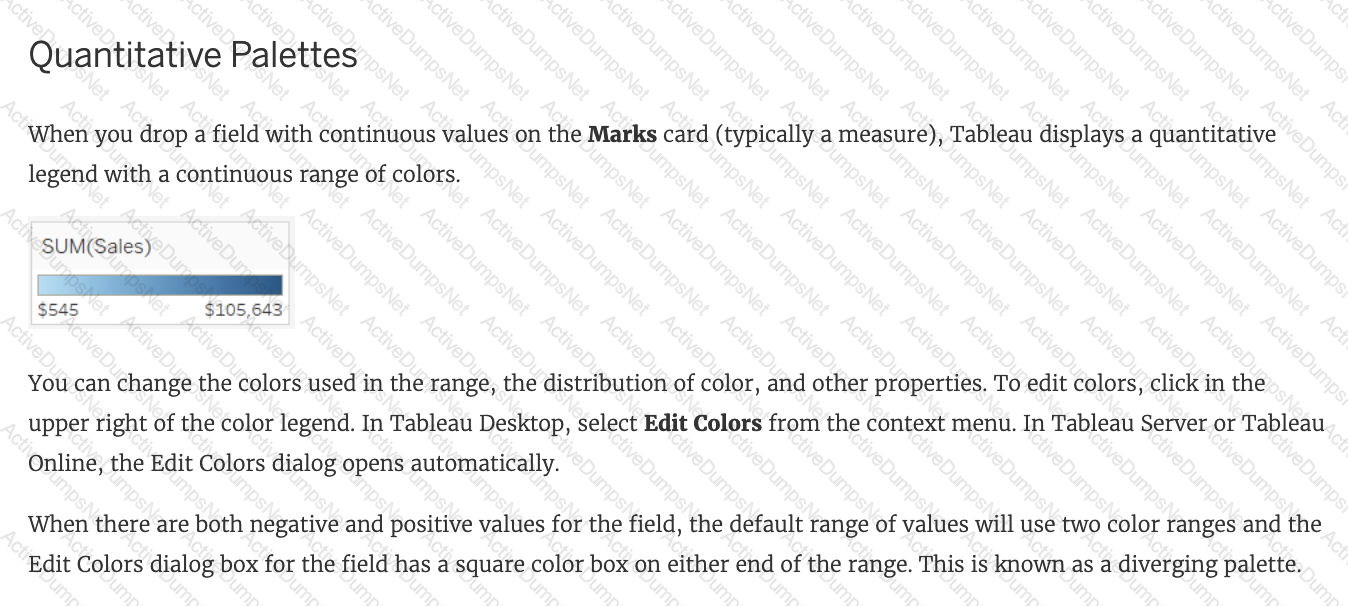
You need to invert the color intensity of a quantitative range. Which option should you use?
Which three elements are included in a packaged workbook (.twbx)? Choose three.
Which three statements accurately describe dimensions? Choose three.
How can you change the default Tableau repository location?
 Graphical user interface, text, application
Description automatically generated
Graphical user interface, text, application
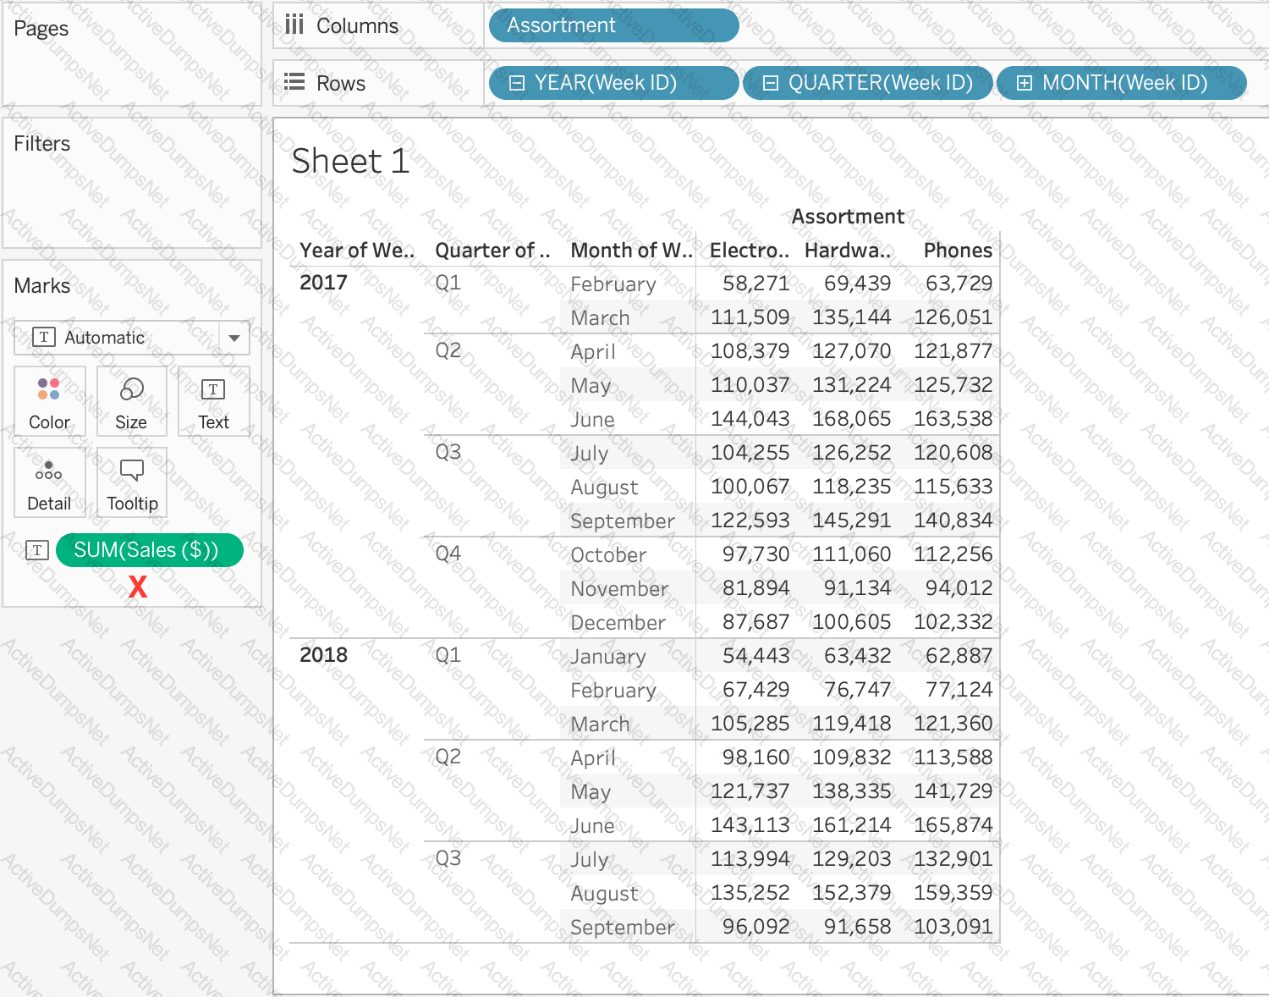
Description automatically generatedUsing the Time Series table, create a cross-tab showing sales for each Assortment broken down by Year and Quarter. In Q4 of October 2017, what was the Average sales amount for the Hardware assortment?
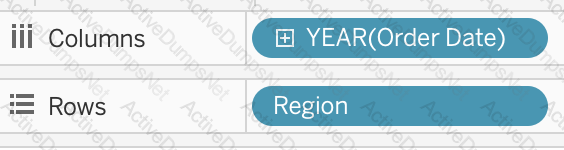
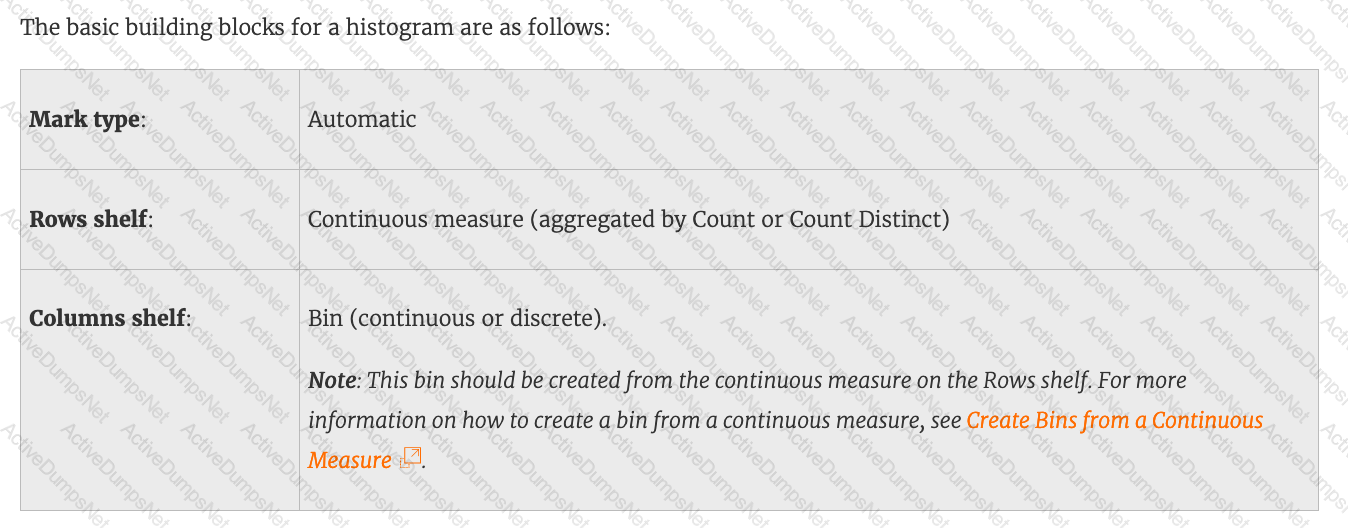
With the Marks card drop-down menu set to Automatic, a line chart will be created whenever you place what on the Rows shelf and the Columns shelf?
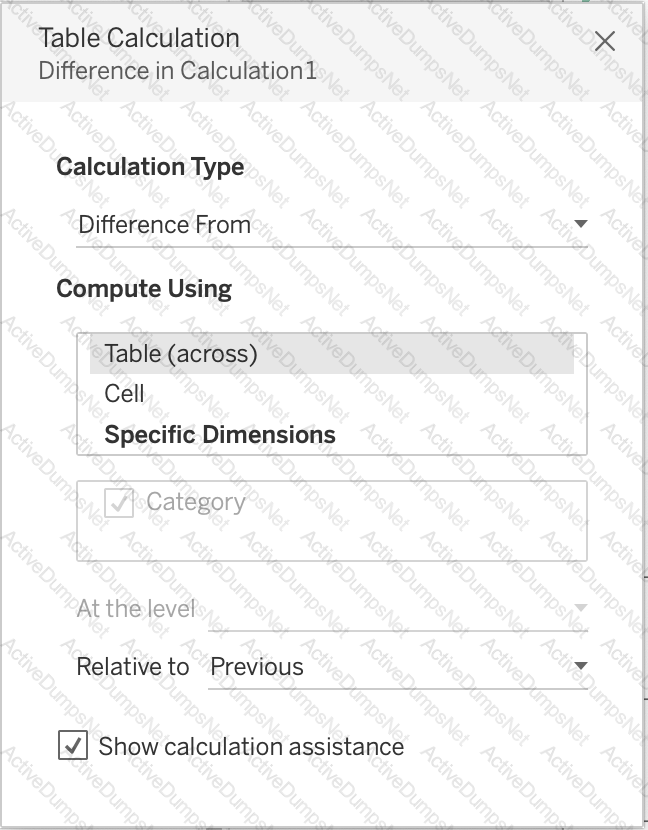
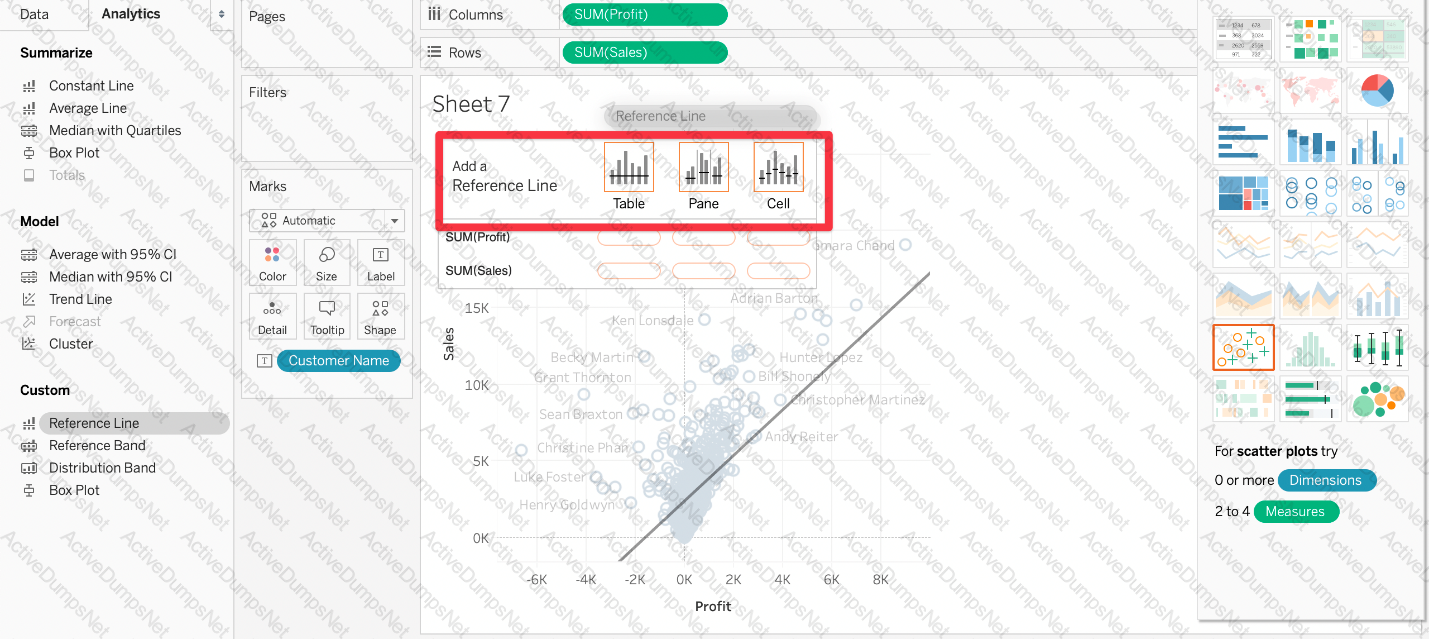
What statement correctly describes a requirement to create a reference line in Tableau?
Is SUM a table calculation?
Which of the following are valid ways of Grouping Data?

Question 30: Skipped
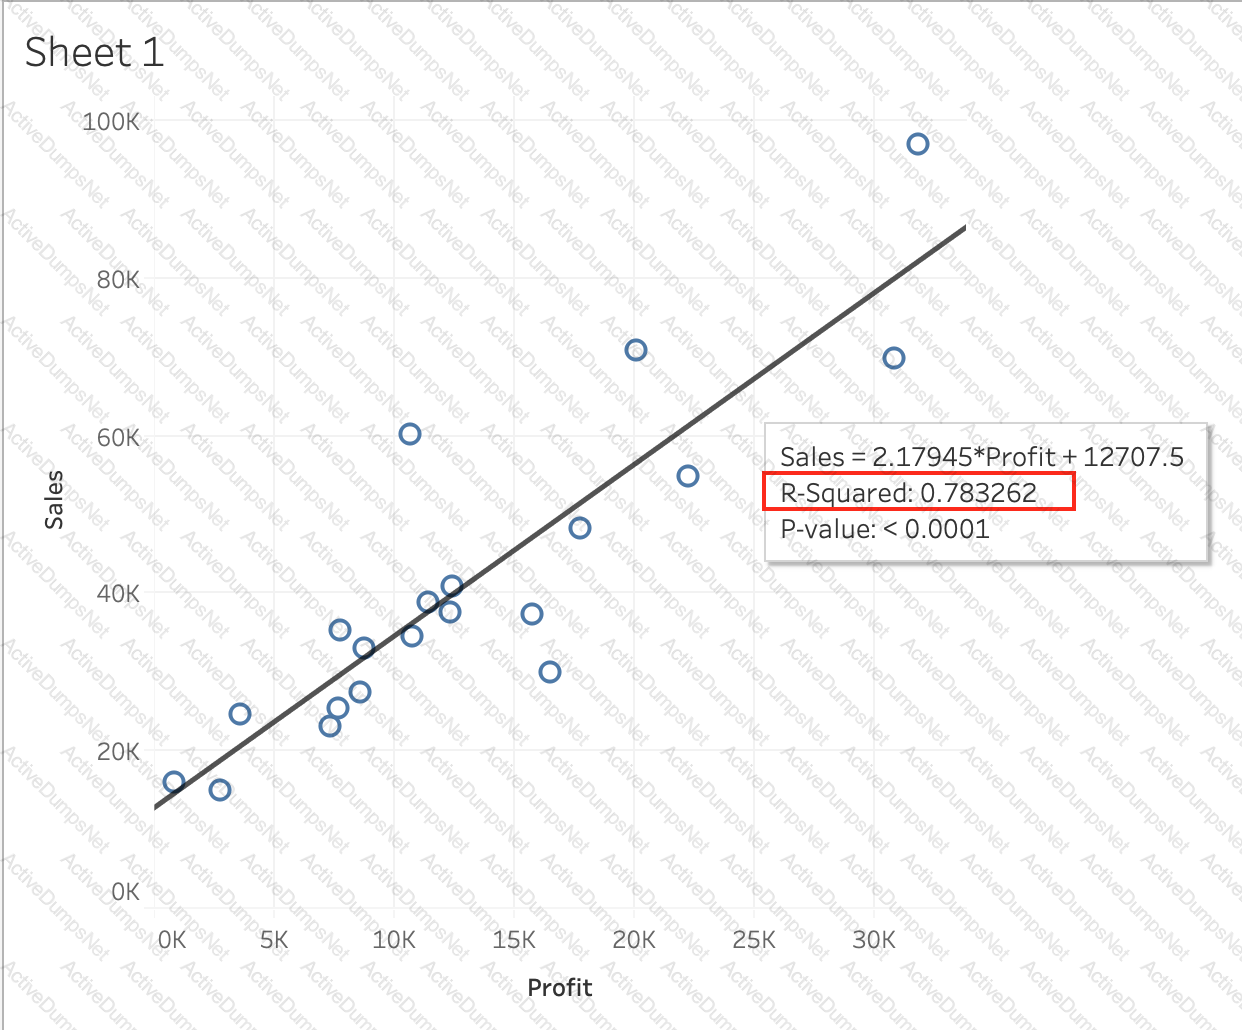
Using the CoffeeChain table, create a scatter plot of Profit (x-axis) vs Sales (y-axis) broken down by State. Add a Linear trend line to the view. What is its R-squared value?
 c
c
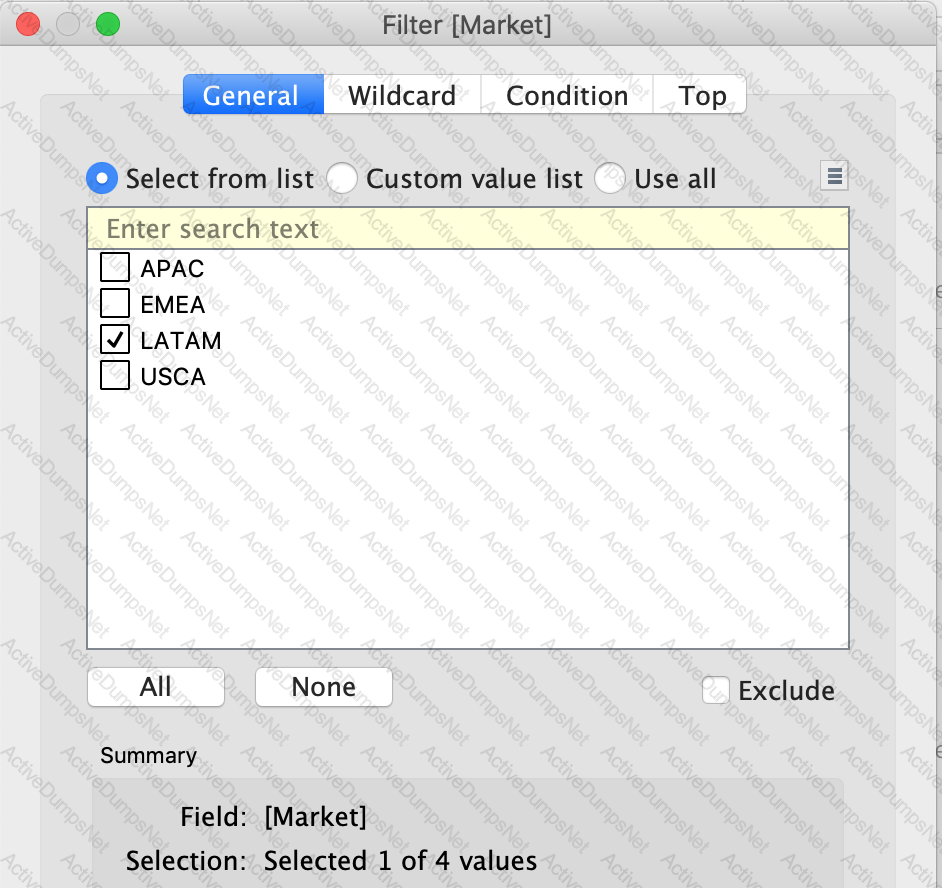
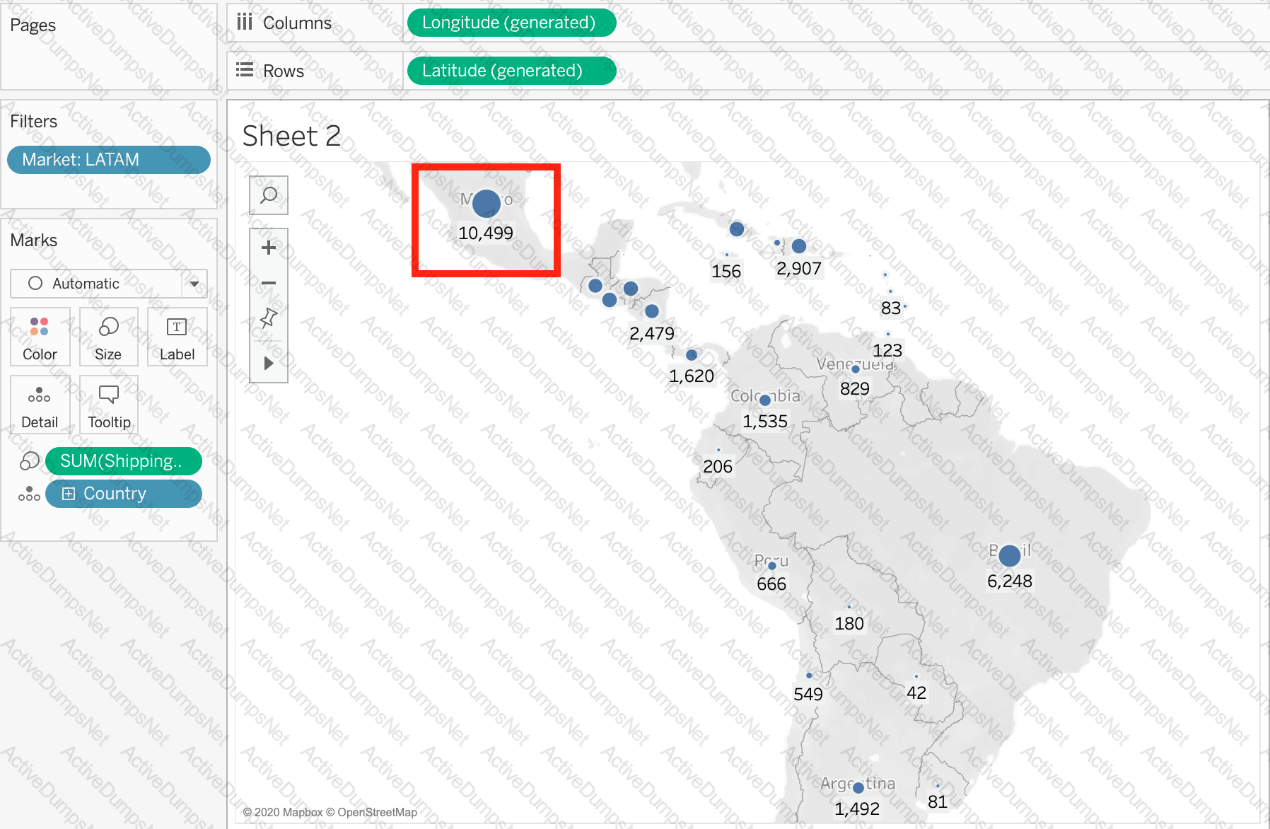
Using the dataset, plot a Map showing all the countries, filtered by Market to only include LATAM. Which country in the LATAM Market has the highest shipping delay (sum of total number of days between the order date and the ship date)?
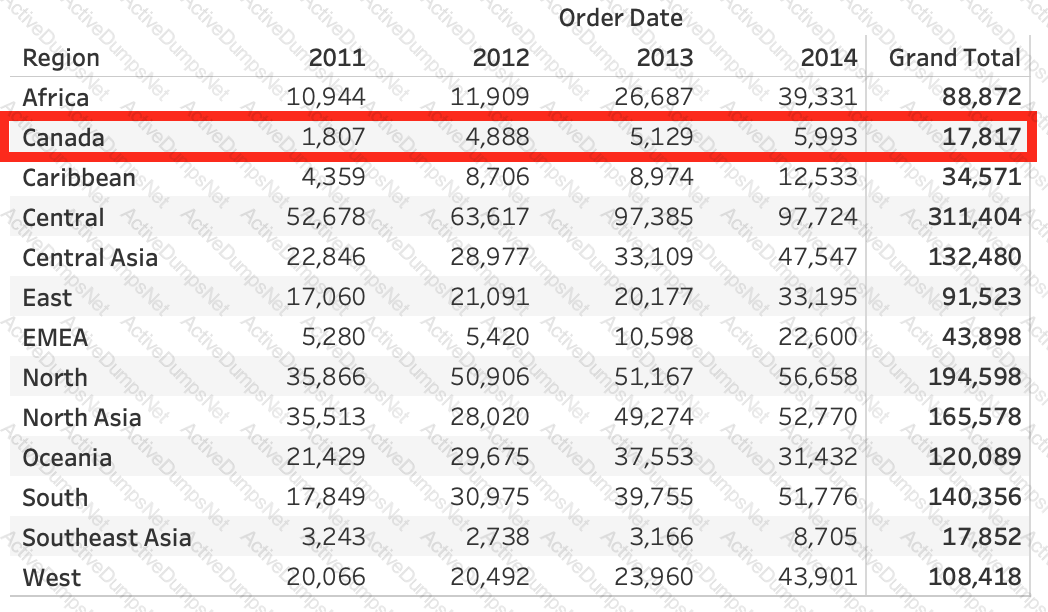
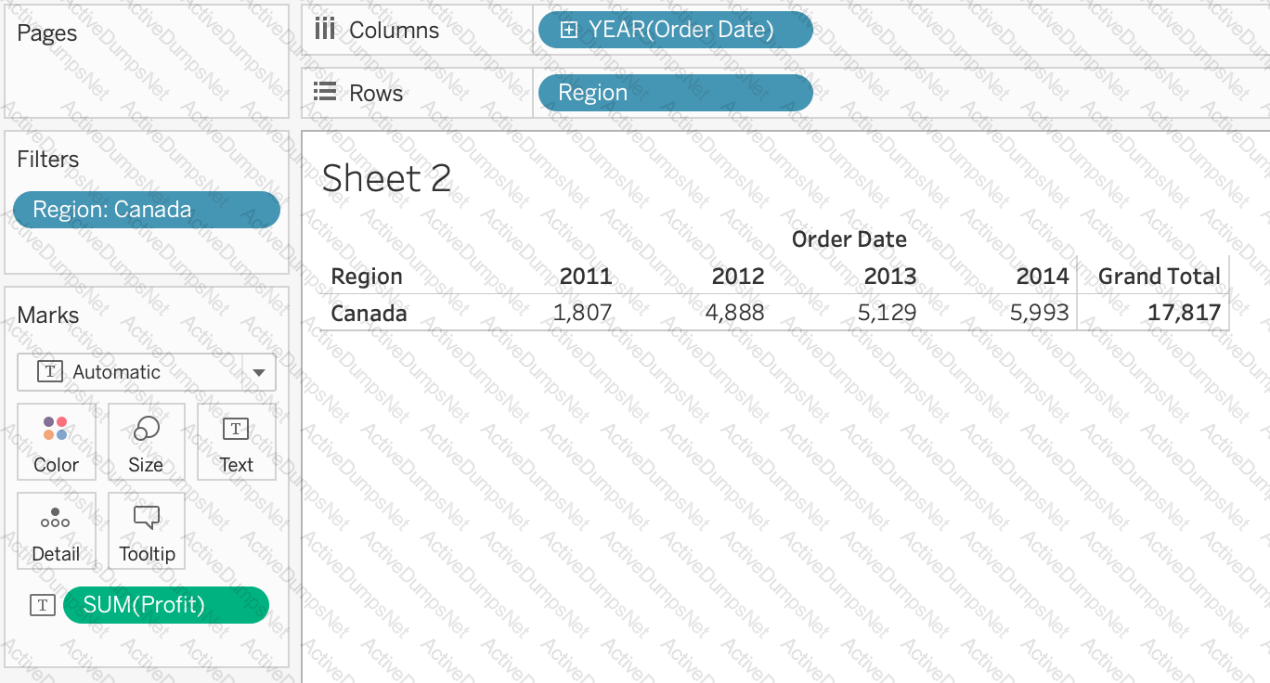
Using the dataset provided, create a crosstab showing the Profit of each Region per Year, then add grand totals to the view. What was the total Profit for Canada in 2012 and the total Profit for Canada for 2011 through 2014, respectively?
Which two options can you use to change the device layout of a dashboard? Choose two.
Dates in Tableau are typically treated as ______________
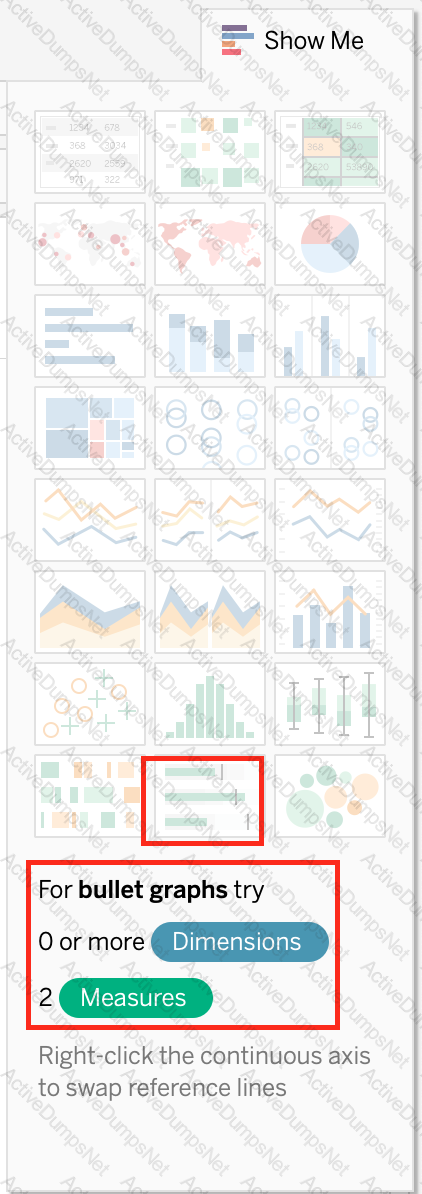
Which of the following represent a valid method to create a Bullet Graph with the LEAST number of fields possible?
Which of the following is a discrete date part?
Which of the following are true about dimensions?
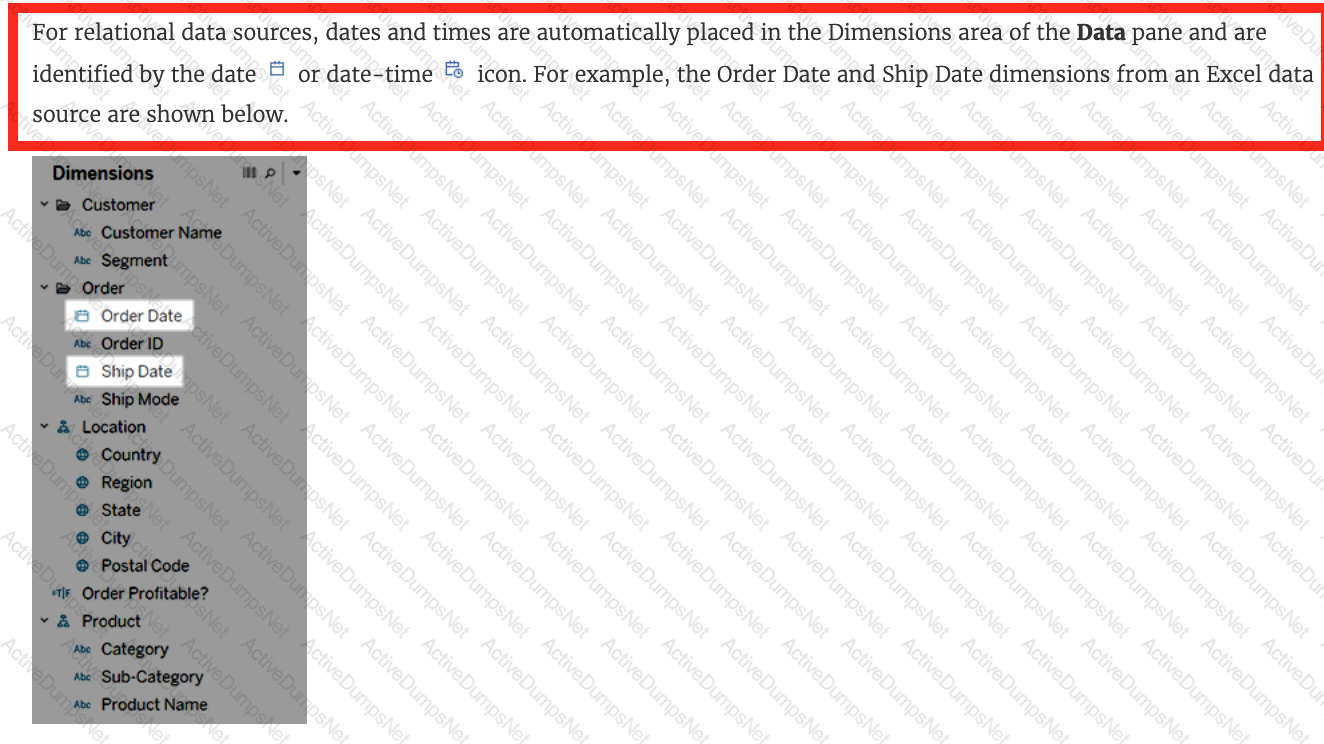
Broadly speaking, when users connect to Tableau, the data fields in their data set are automatically assigned a ____________ and a ____________.
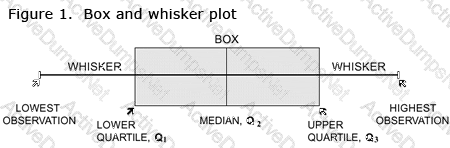
What does the box in a box plot represent?
What does it imply if a field has a blue background?

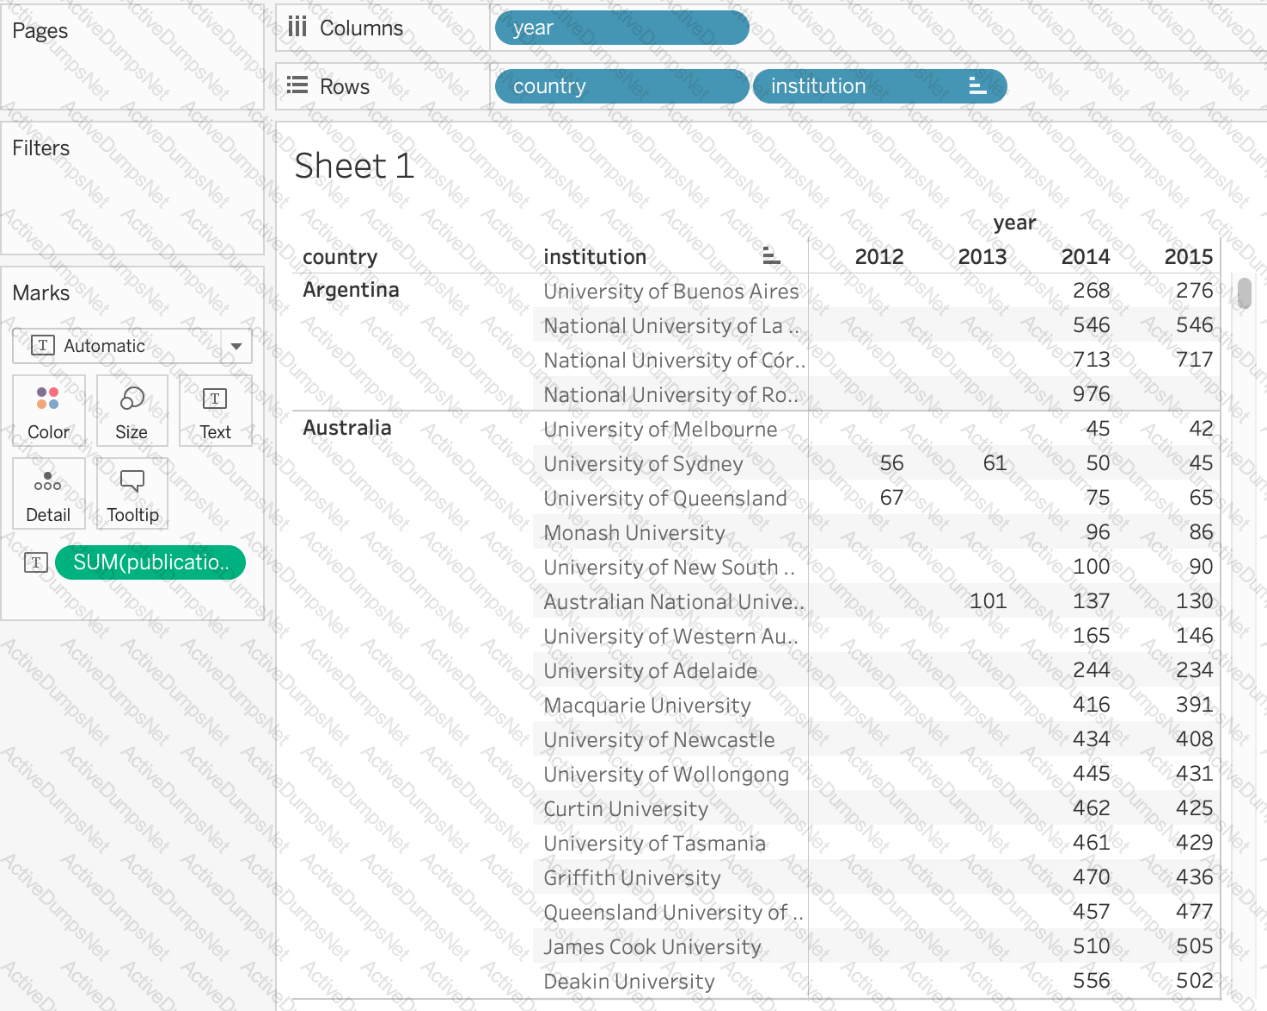
Using the cwurData table, create a cross-tab showing the number of Publications per Country broken down by Institution, and filtered by Country to only show United Kingdown (UK). For the University of Manchester, what percent of the total publications were contributed in 2014?
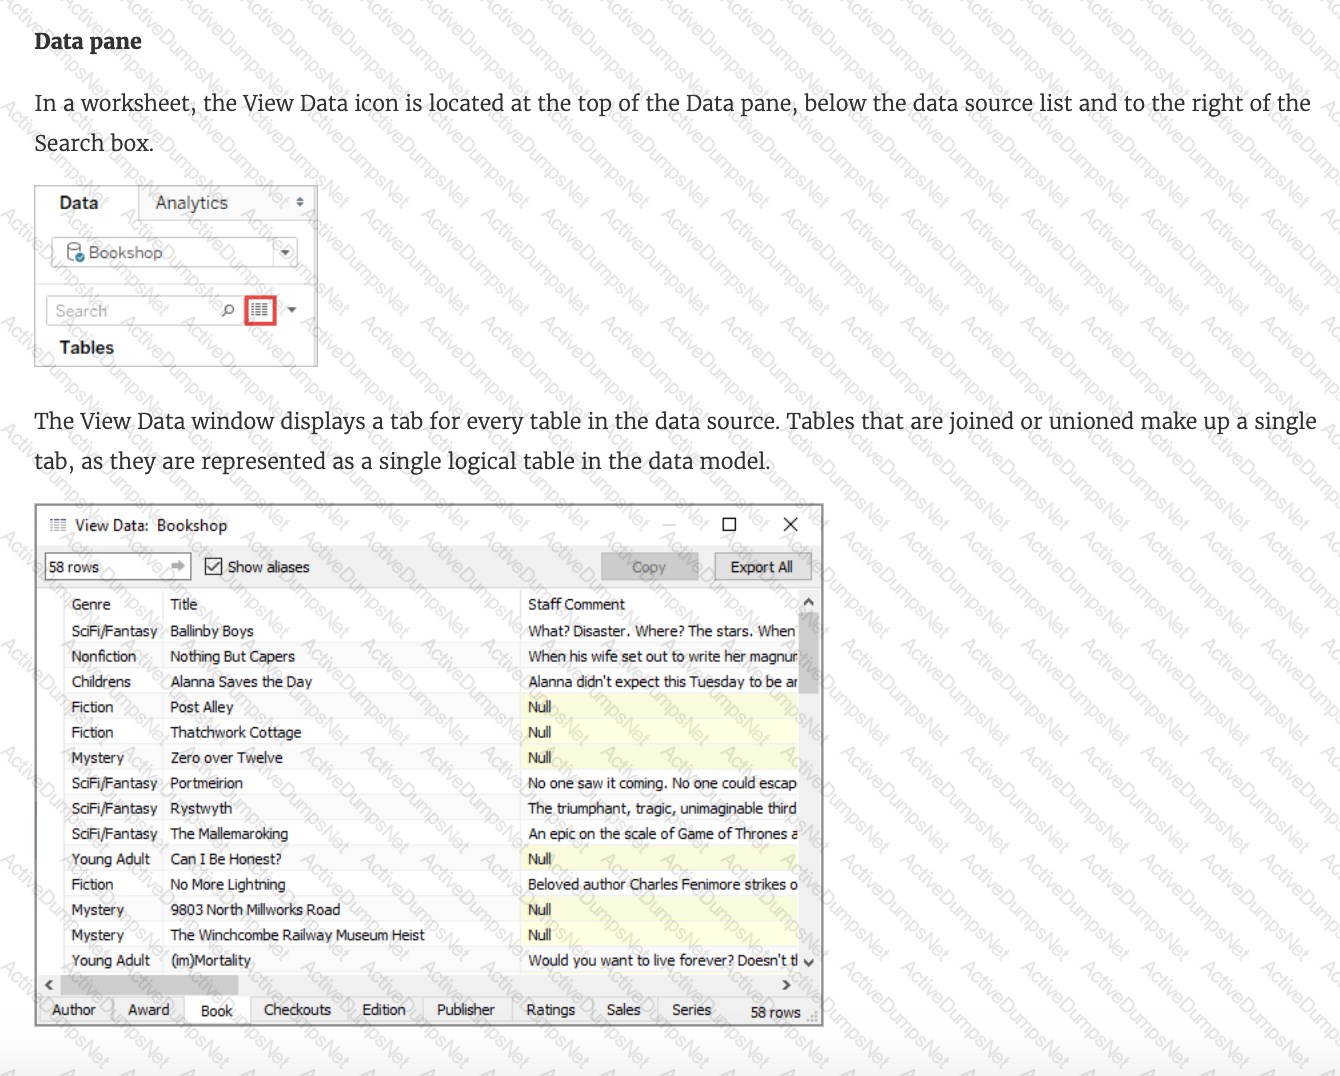
The View Data window displays as much of the data as possible by default, up to _______________ rows.
______________ refers to the level of detail for a piece of data, wherever you are looking.
How does Tableau know at which level to aggregate values?
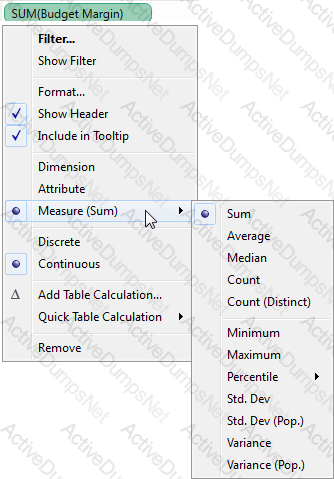
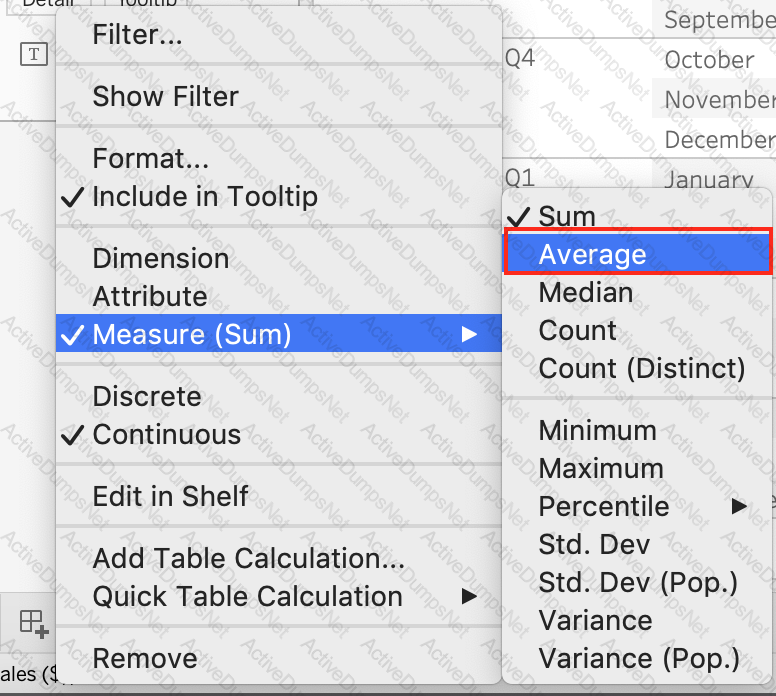
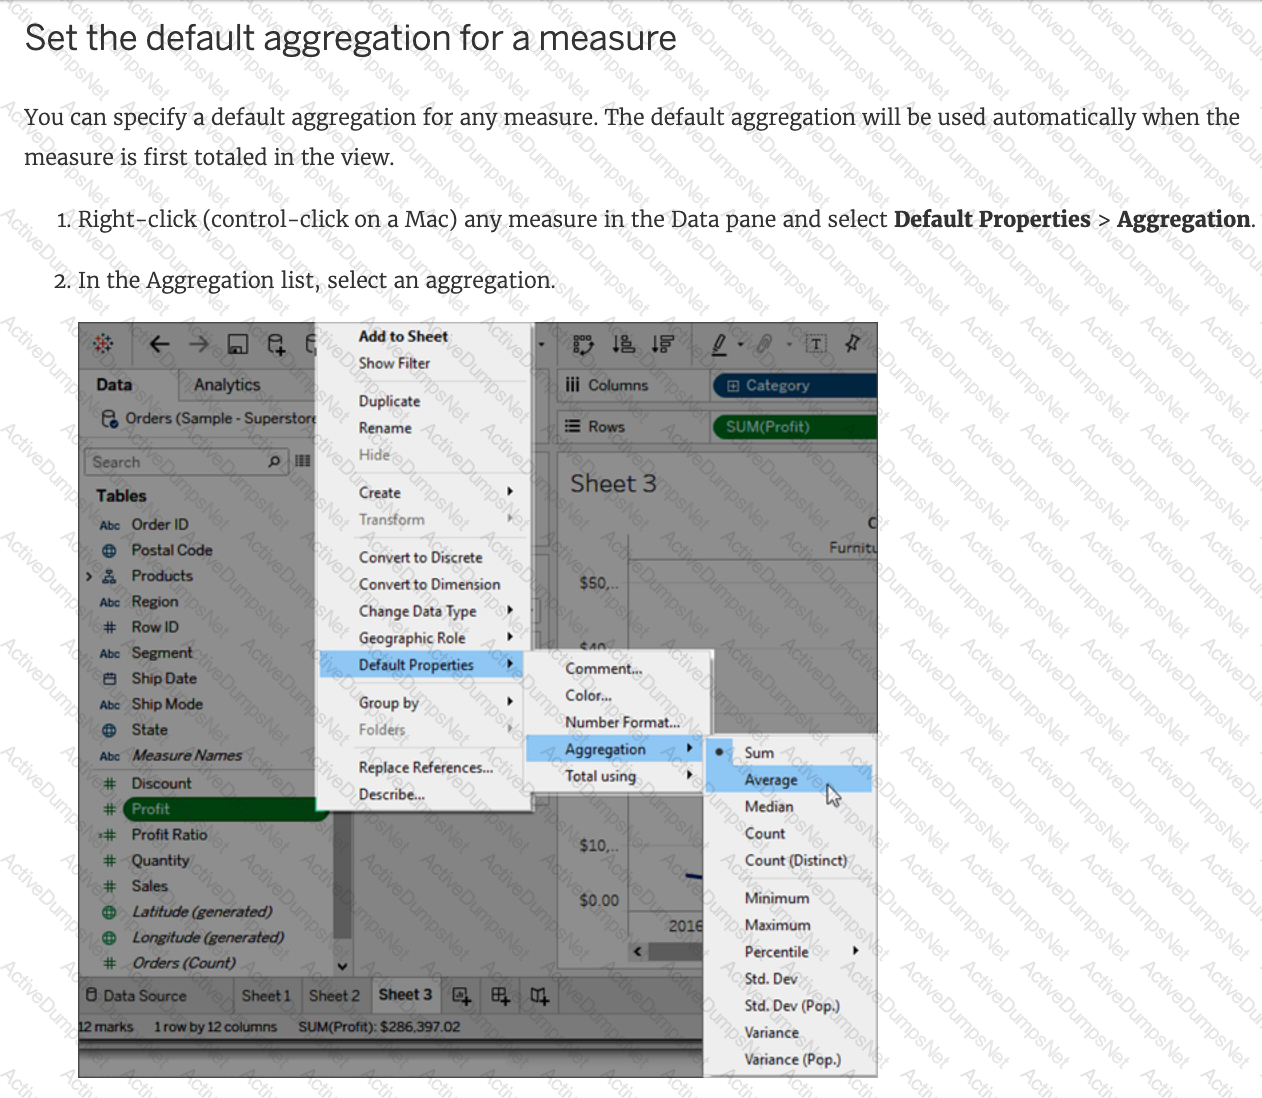
How can you change the Default Aggregation for a measure in Tableau?
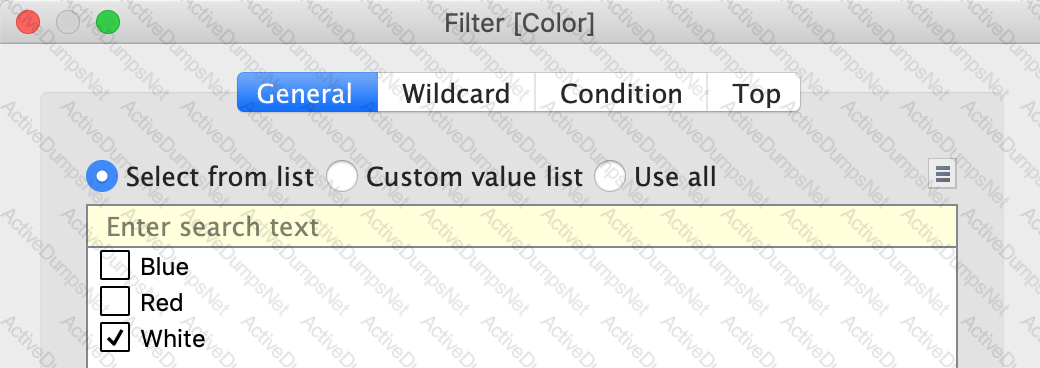
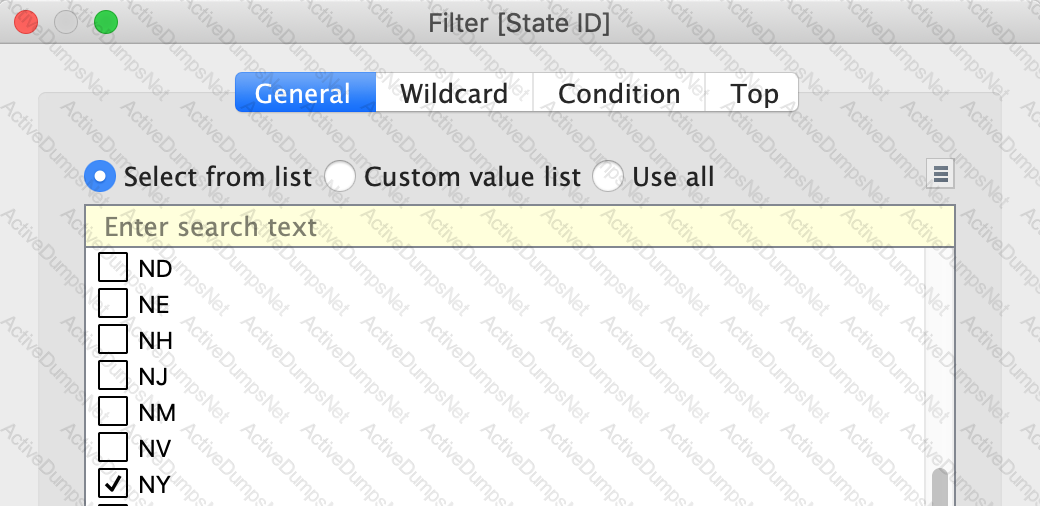
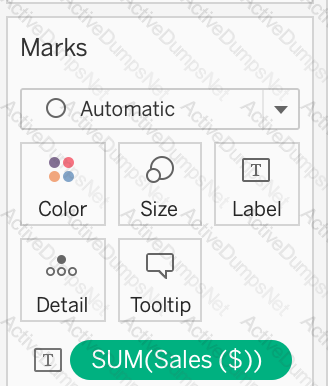
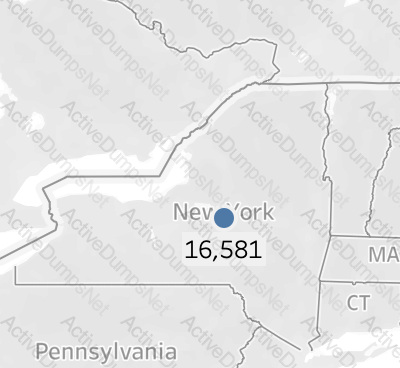
Using the Geo Data Table, create a Map showing Sales made per State. For the State of New York (NY), what was the amount in Sales ($) made for Phone Assortments with White color?

Using the Time-series table, create a cross tab showing the Sales for each Item Number-ID, broken down by Assortments, then add Grand totals to the view. Which Item Number ID made the maximum sales across all assortments?
You have a visualization that uses multiple types of sorting.
How can you clear all sorting of the visualization?
Which of the following is the correct way to calculate Profit Ratio in Tableau?
A ________________ is a single zip file that contains a workbook along with any supporting local file data and background images. This format is the best way to package your work for sharing with others who don’t have access to the original data.
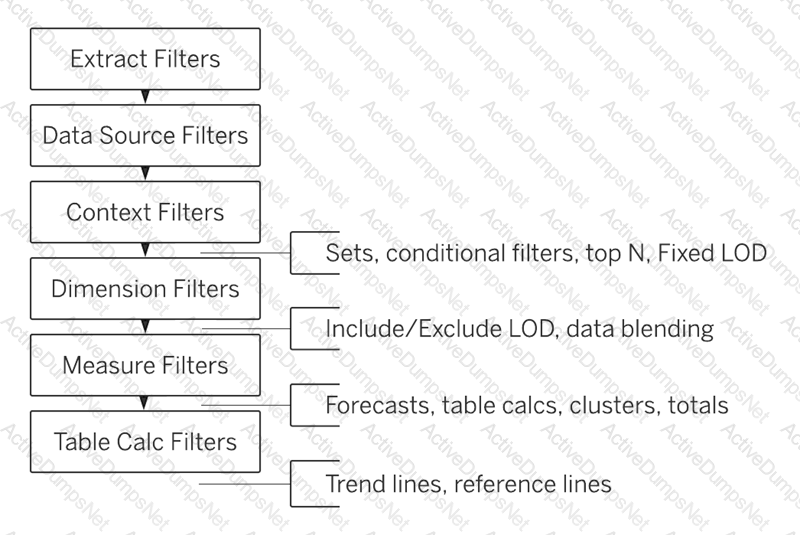
True or False: Context Filters are executed after Data Source filters

How can you format numbers in Tableau as currency?
To display data that has both negative and positive quantitative values, Tableau Desktop will display marks by using__________________as the default.
Dragging a ______________ to colour creates distinct colours for each item whereas dragging a ______________ to colour creates a gradient
True or False: A sheet cannot be used within a story directly. Either sheets should be used within a dashboard, or a dashboard should be used within a story.

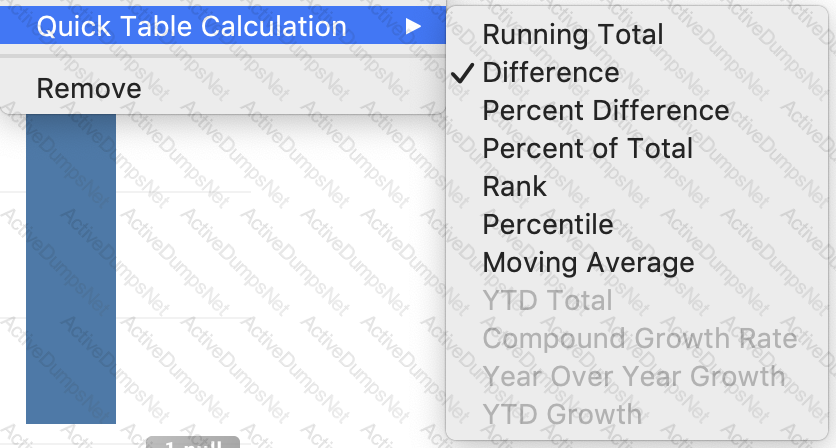
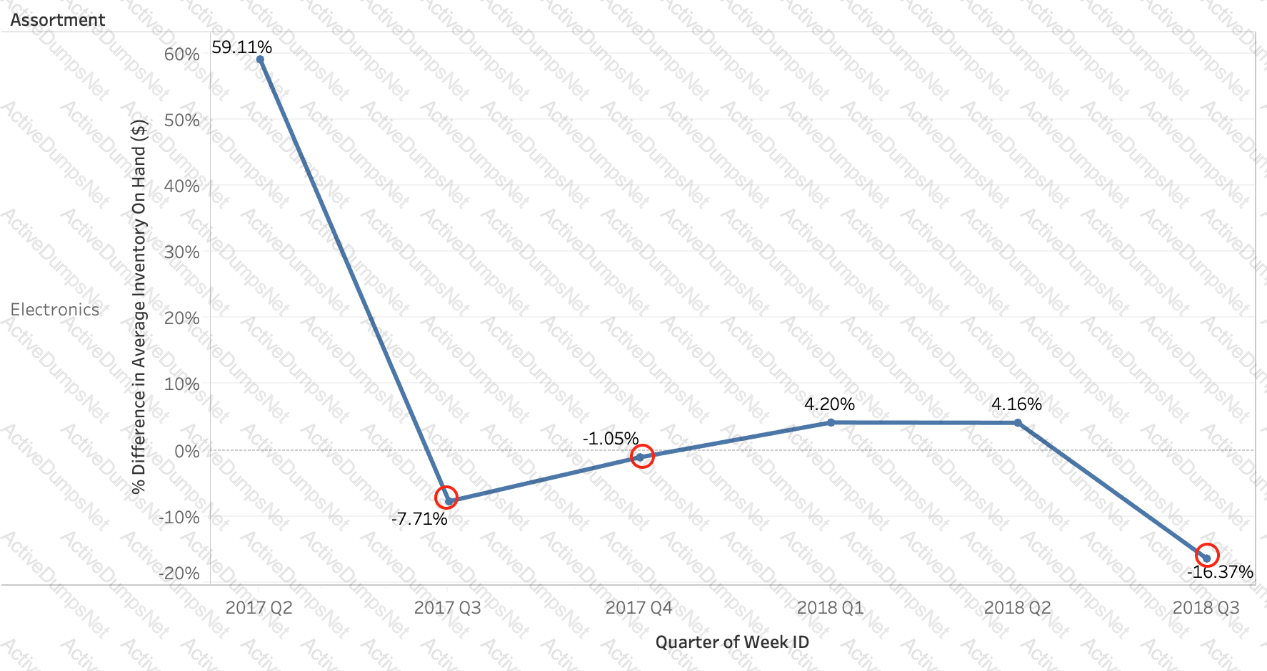
Using the Time Series table, create a chart that shows the percent difference in Average Inventory on Hand for each Assortment by year and quarter.
How many quarters did the Electronics Assortment show a negative percent difference in the Average Inventory On Hand?
You create a crosstab that shows a list of 100 hotel chains alongside their average nightly cost. You also create two groups showing, respectively, the top 10 and bottom 10 hotel chains by cost, with subtotals.
What should you do to improve the crosstab and compare the two groups to all the remaining hotel chains?
Which two filter modes can you use with dimension filters? Choose two
You are creating a combined axis chart.
Where should you drag the second measure after dragging the first measure to the Rows shelf?
You have a workbook that contains one data source and you need to combine data from another database. What should you do first?
Which aggregation is available without requiring a table calculation or calculated field?
DOWNLOAD THE DATASET FROM: https://drive.google.com/drive/folders/1WXzqsrNmXVdmQ-574wld4InEplyKT8RP?usp=sharing (if you haven't already)
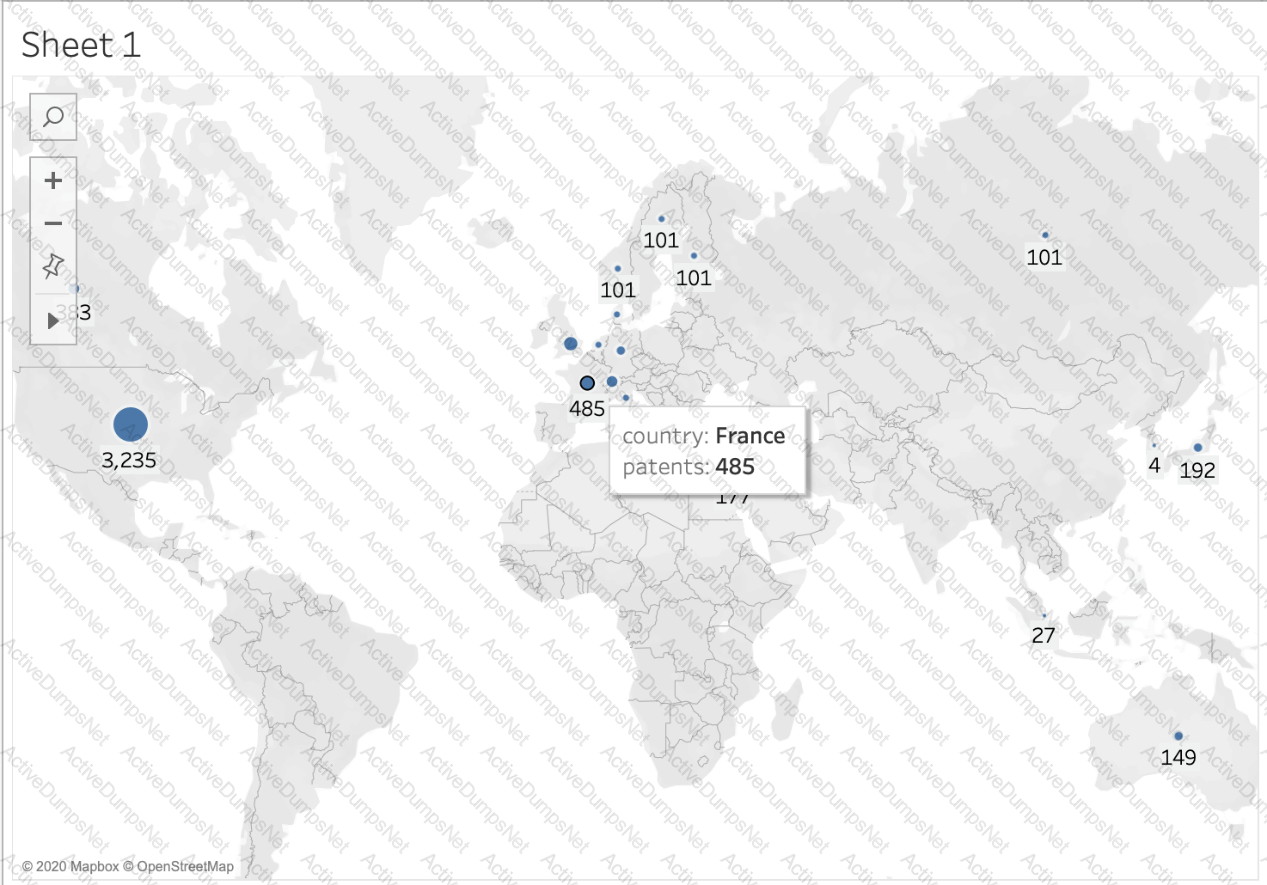
Using the cwurData table, plot a Map to see which country had the Second highest number of patents in the Year 2013?
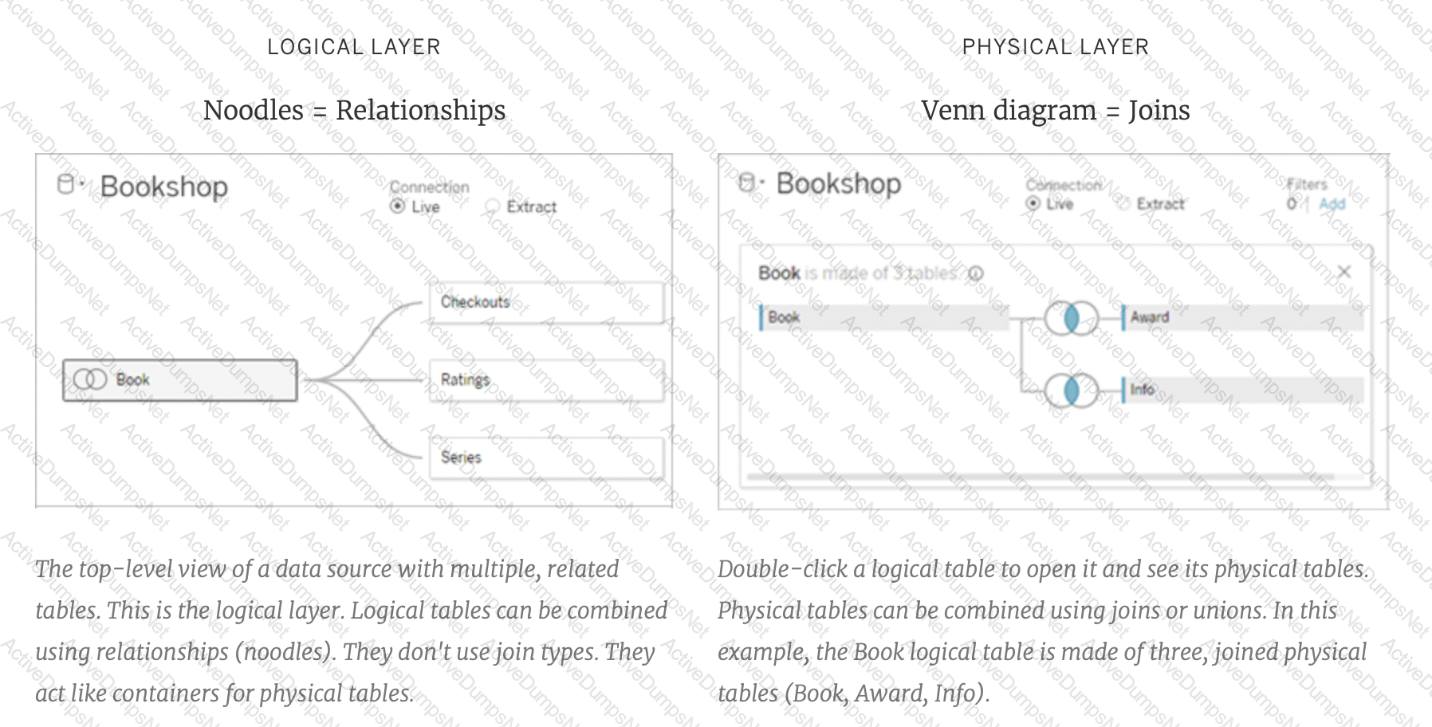
Relationships are represented by __________________ and operate at the ____________________.
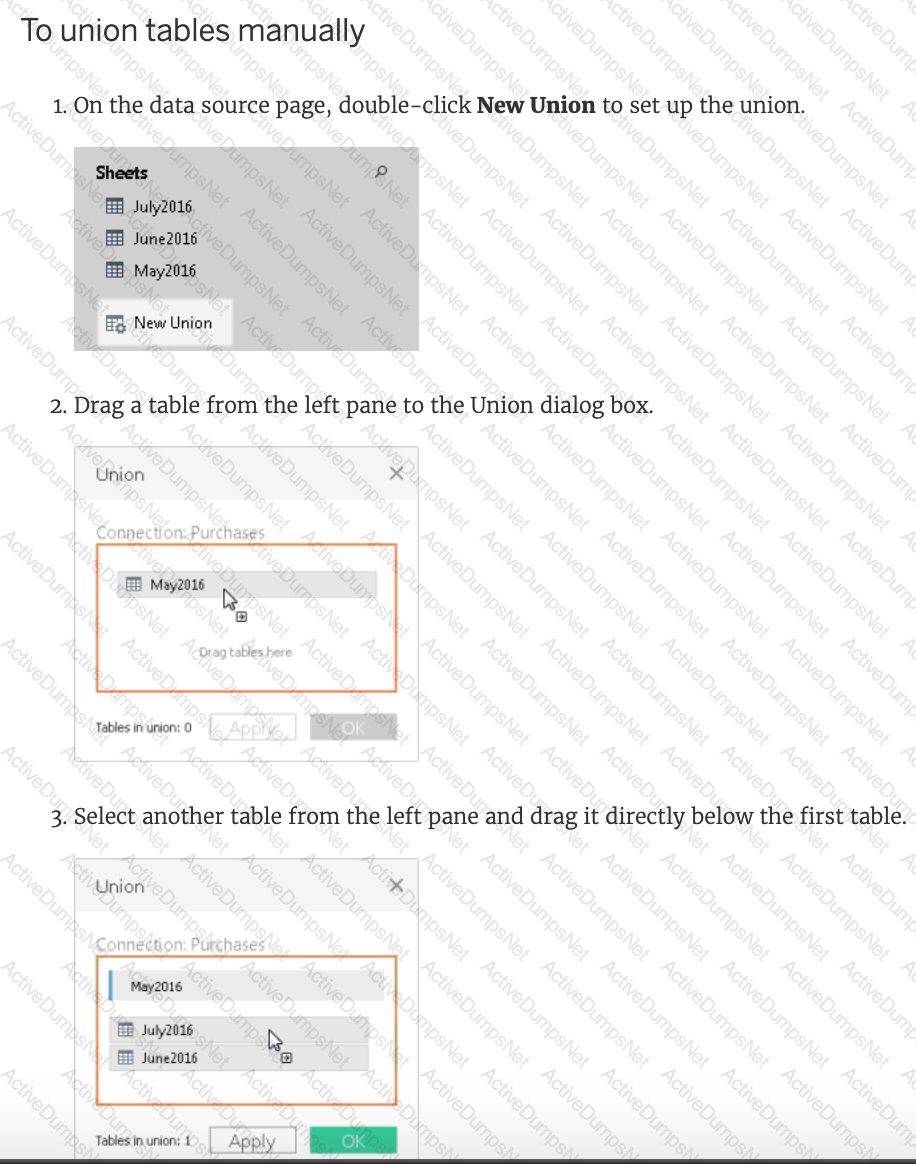
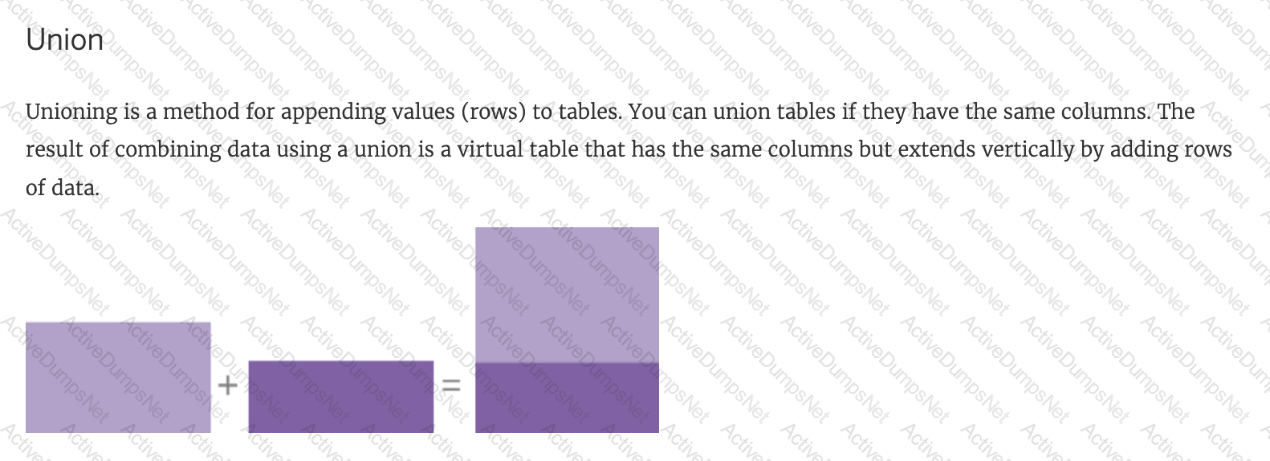
______________ is a method for appending values (rows) to tables. You can use this method if both tables have the same columns. The result is a virtual table that has the same columns but extends vertically by adding rows of data.
How can you create a packaged data source?
True or False: You get different filtering options for categorical and quantitative data
Which of the following chart type makes use of 'binned' data?
Which statement accurately describes a join?
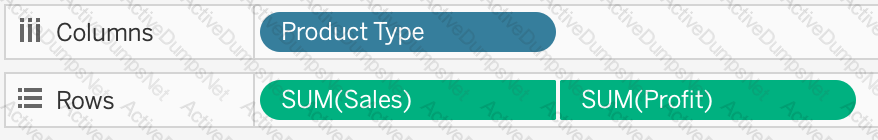
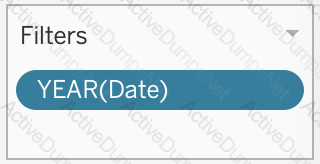
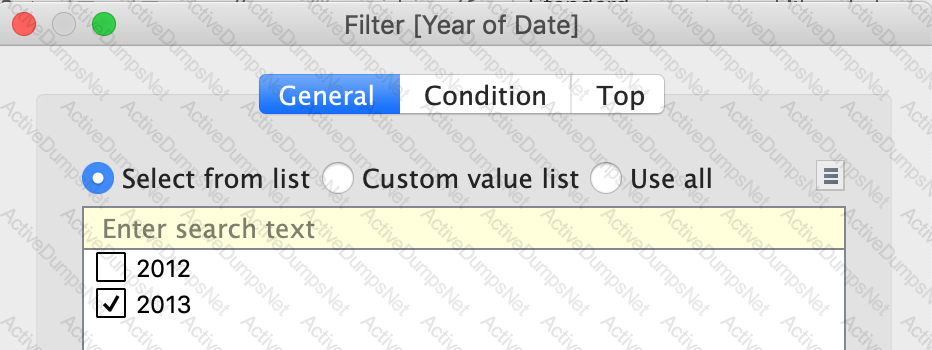
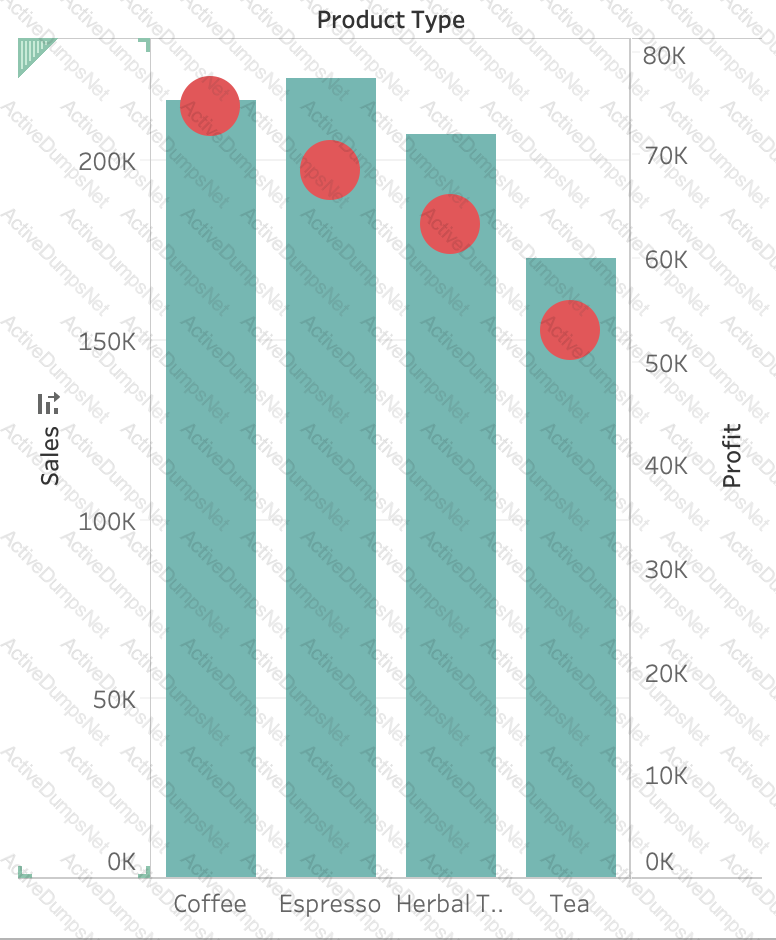
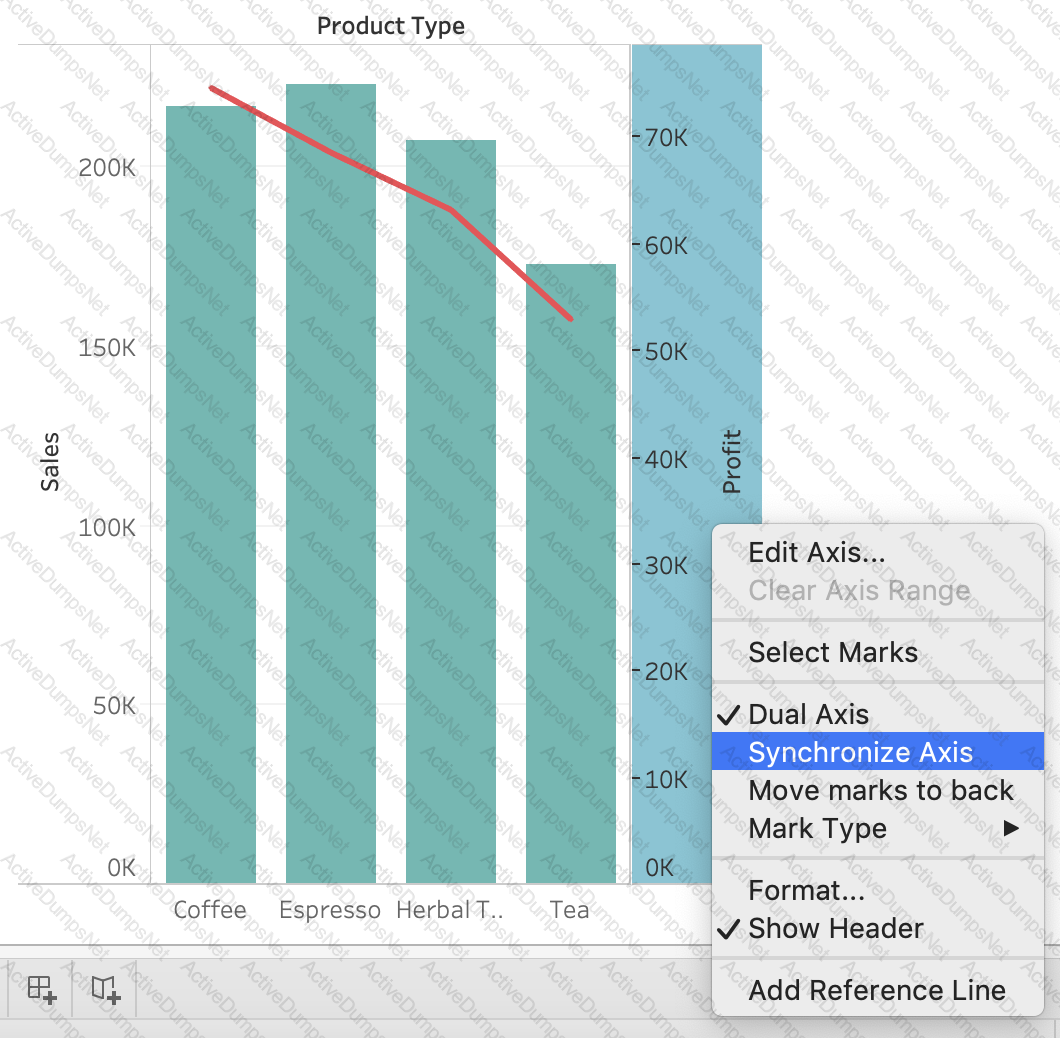
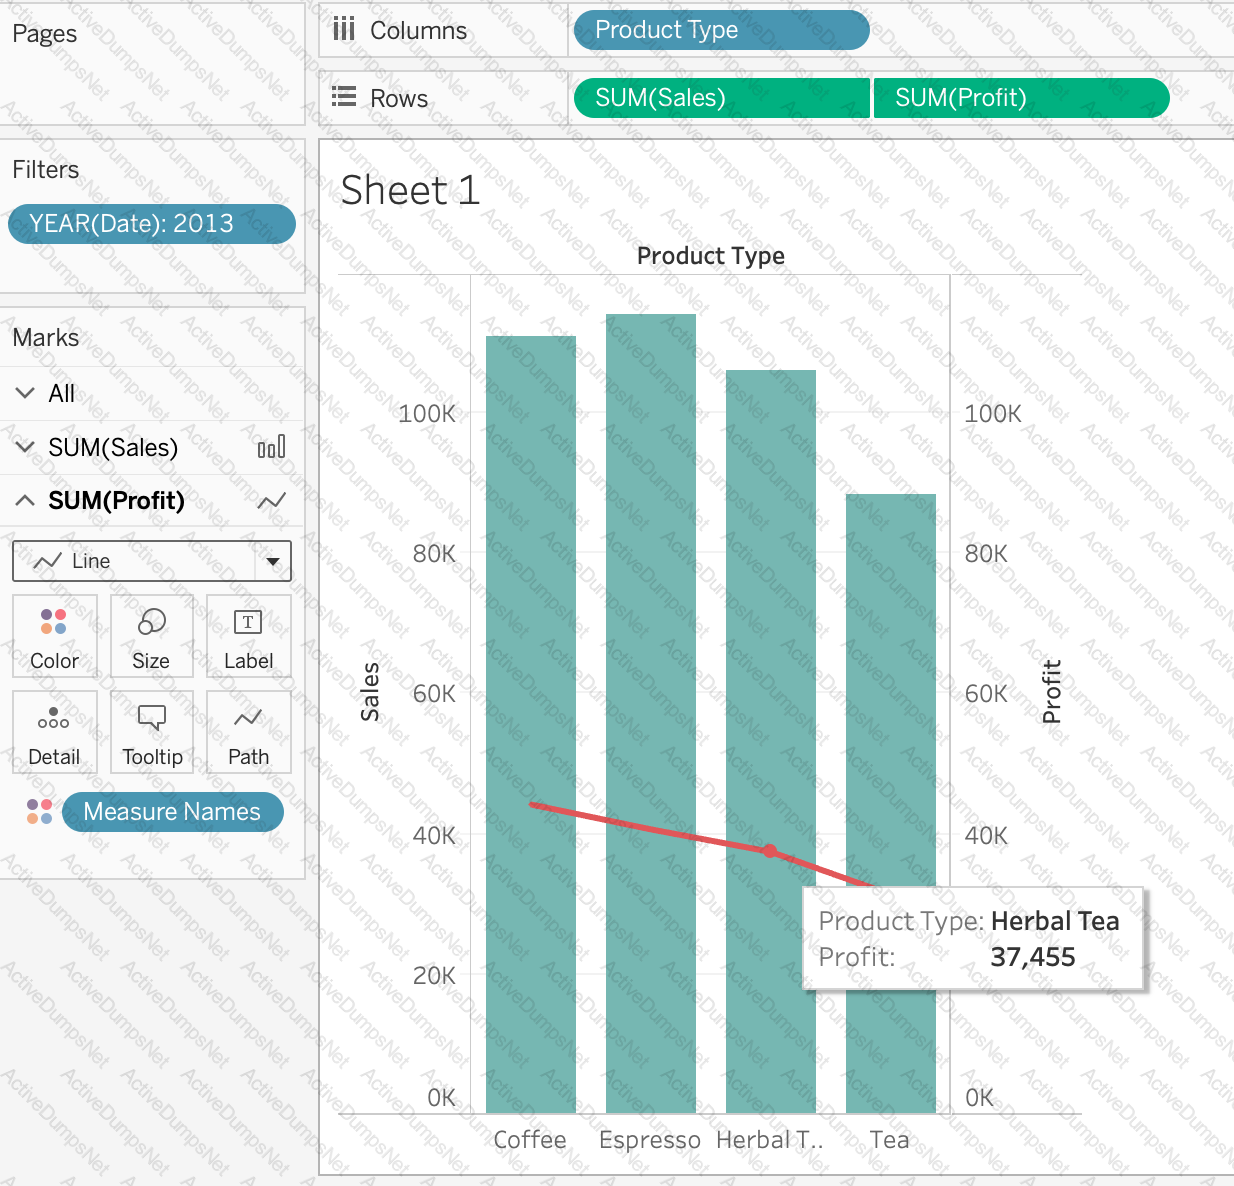
Using the CoffeeChain table, create a Dual Axis chart showing the Sales (Bar chart) and Profit (Line Chart) for each Product type. What was the Profit for the Herbal Tea product type in 2013?
________________ can only create header. _______________ will create header and axis both.
You need to display the complete list of potential data connections when you connect to a server. What action should you perform?
What are two correct methods for creating a visual group? Choose two.
Which two actions can you perform when you join tables from multiple connections? Choose two.
What is a Tableau story point?
What should you use to apply bold text formatting to rows or columns independent of each other?
Which mark type is used in a highlight table?
Which of the following is a benefit of using a Tableau Data Source (.tds)?
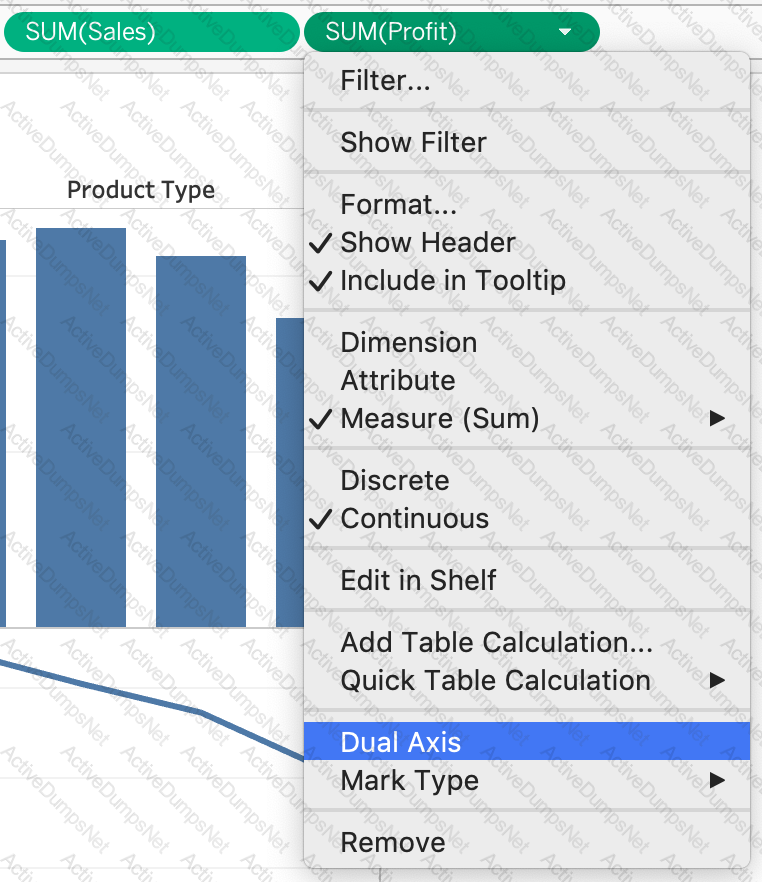
In order to avoid any confusions, what should you do after creating a Dual-axis chart?
 Graphical user interface, chart, line chart
Description automatically generated
Graphical user interface, chart, line chart
Description automatically generated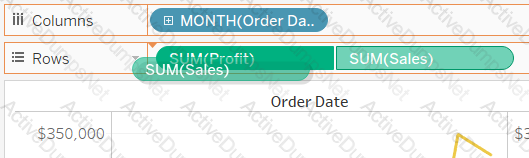 Graphical user interface, application
Description automatically generated
Graphical user interface, application
Description automatically generatedYou have the following legend.
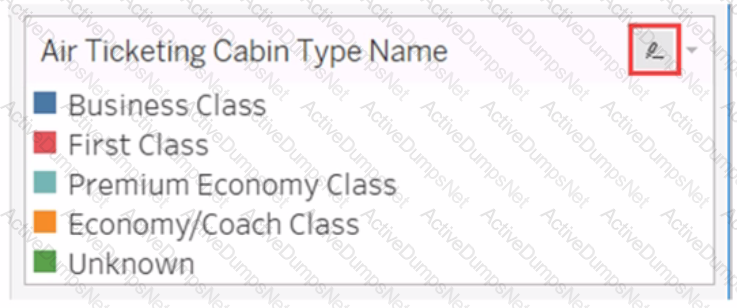
What occurs when you click the icon to the right of Air Ticketing Cabin Type Name?
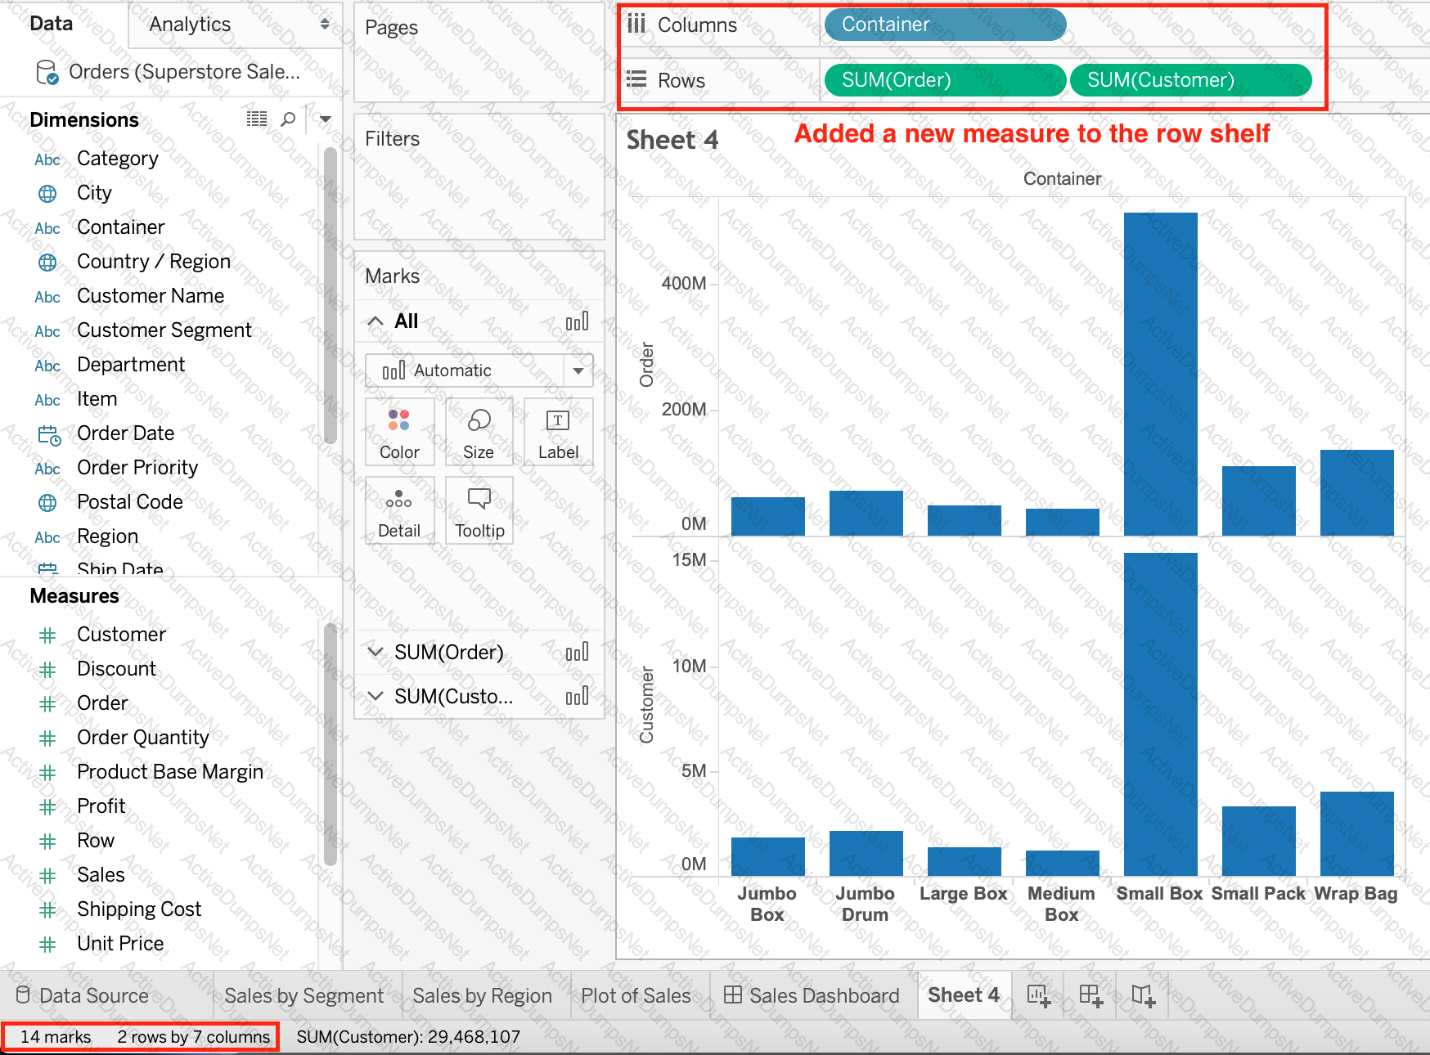
Suppose I have the following view. What will be the total number of marks if I drag a new measure to the row shelf vs the column shelf?
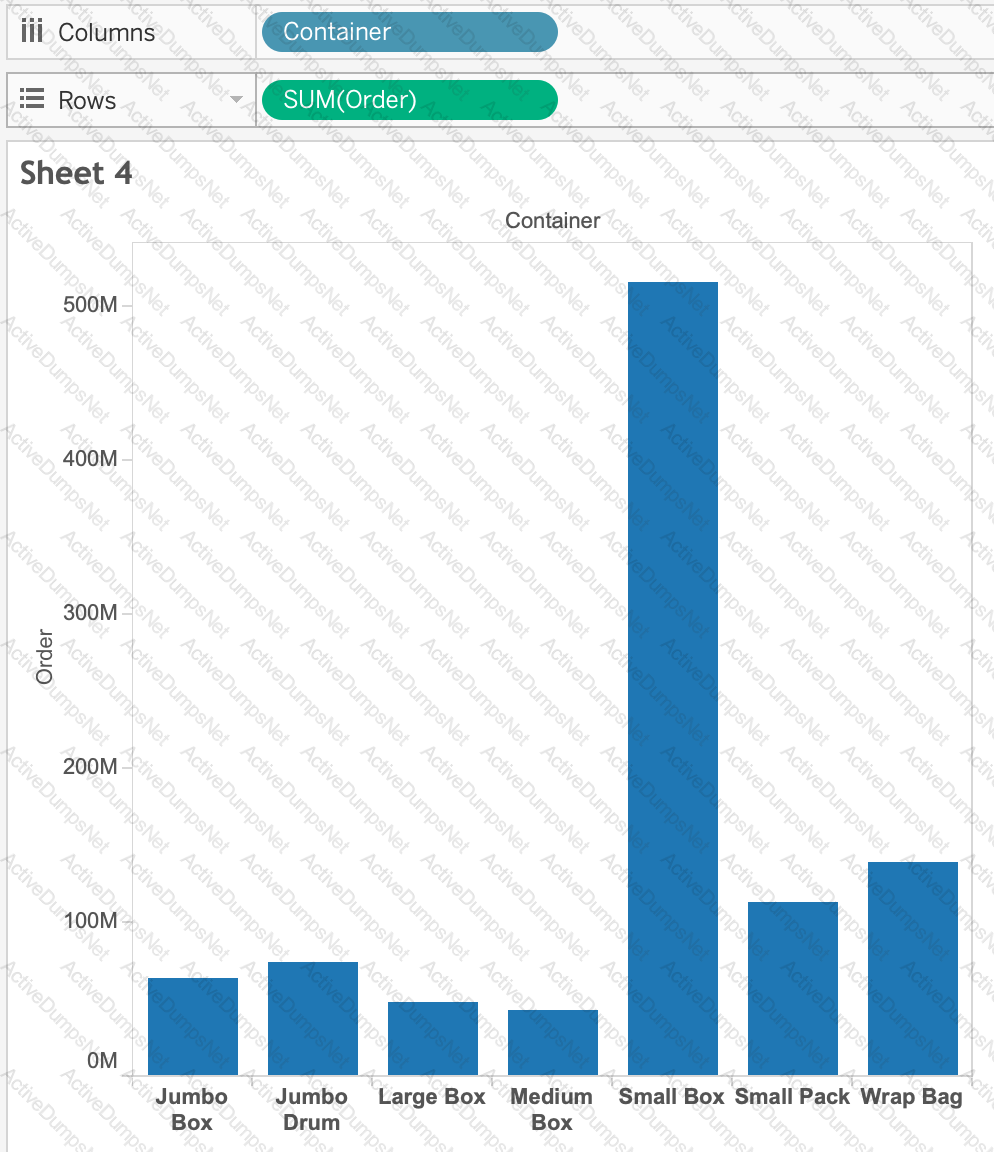
 Graphical user interface, chart, bar chart
Description automatically generated with medium confidence
Graphical user interface, chart, bar chart
Description automatically generated with medium confidence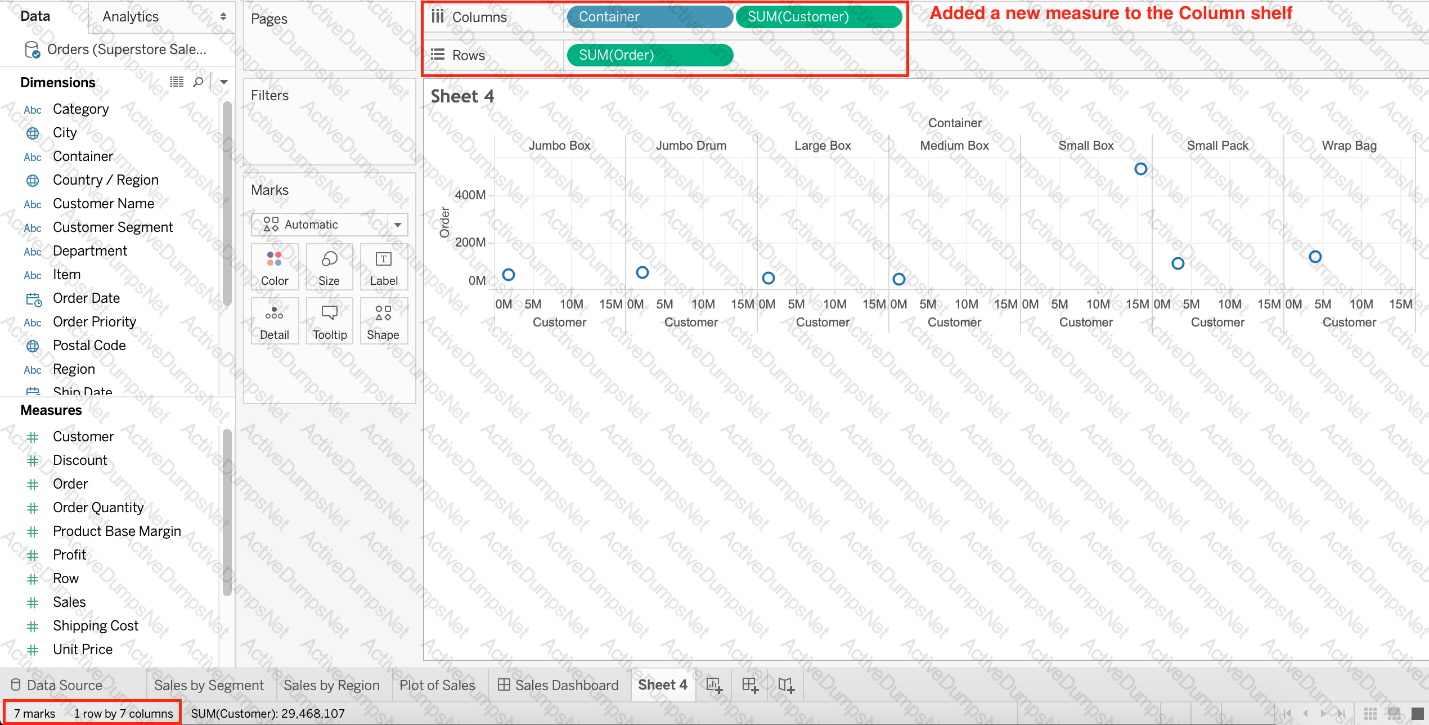 Graphical user interface, text, application
Description automatically generated
Graphical user interface, text, application
Description automatically generatedWhich of the following is NOT a valid official data source in Tableau Desktop?
When you connect to a new data source, all worksheets that previously referred to the original data source now refer to the new data source. If the new data source does not have the same field names as the original workbook, the fields are marked with an exclamation point

. Which feature helps us fix this issue?
 . You can quickly resolve the problem by replacing the field’s references.
Which of the following are valid options to define the scope of a reference line? Choose 3.
 Graphical user interface, chart
Description automatically generated
Graphical user interface, chart
Description automatically generatedWhat are two outcomes when you drag a continuous date value to the Rows shelf? Choose two,
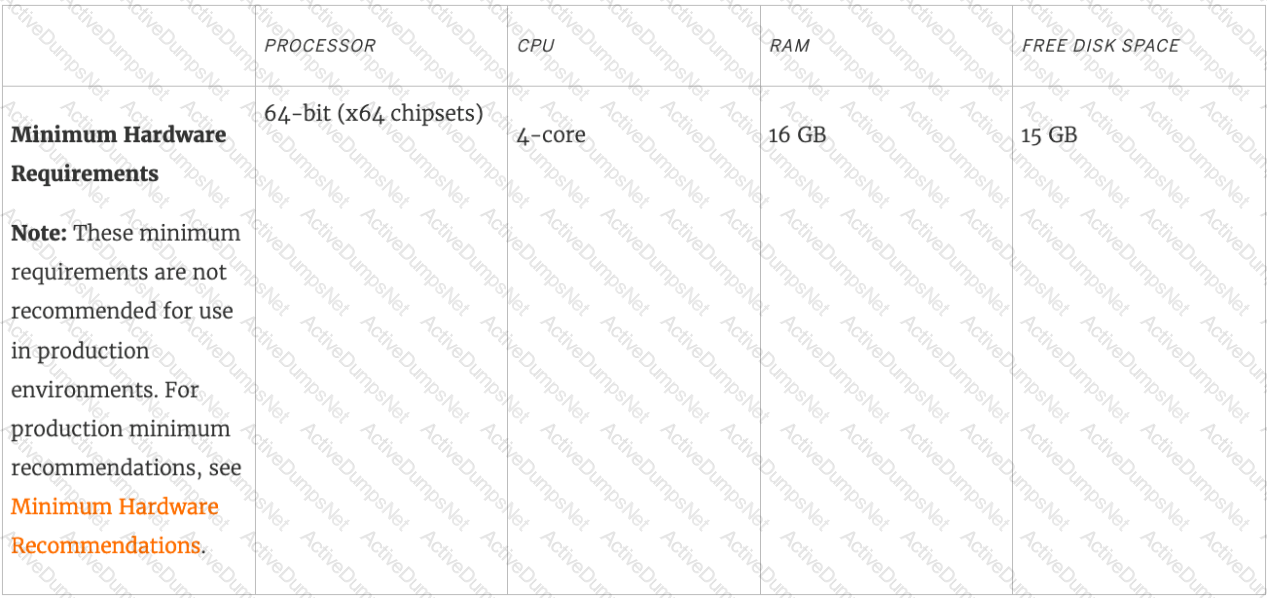
What is the minimum amount of RAM recommended for any production use of Tableau Server?
Which of the following options best describe measures?
You have a dashboard that shows car rental statistics by city, including a field named Car Dropoff City in the view. A URL action in the dashboard uses https://en.wikipedia.org/wiki/
When you click Salt Lake City in the view, to where will the URL action direct you?
Which of the following are valid objects when creating a dashboard in Tableau? Choose 4.