Salesforce Analytics-DA-201 Salesforce Certified Tableau Data Analyst Exam Practice Test
Salesforce Certified Tableau Data Analyst Questions and Answers
You have the following dashboard that contains two visualizations.
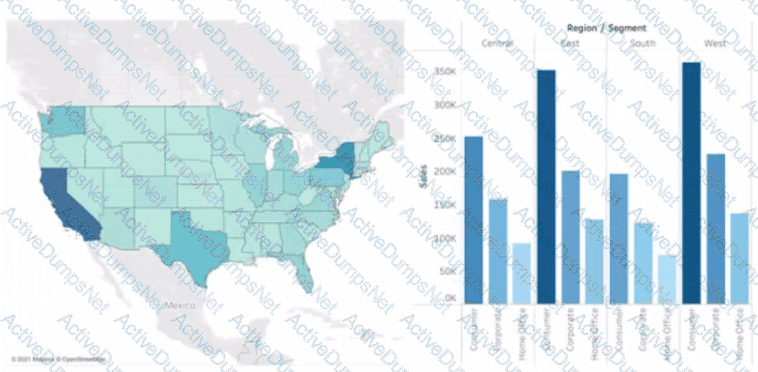
You want to show only one visualization at time. Users must be able to switch between visualizations.
What should you me?
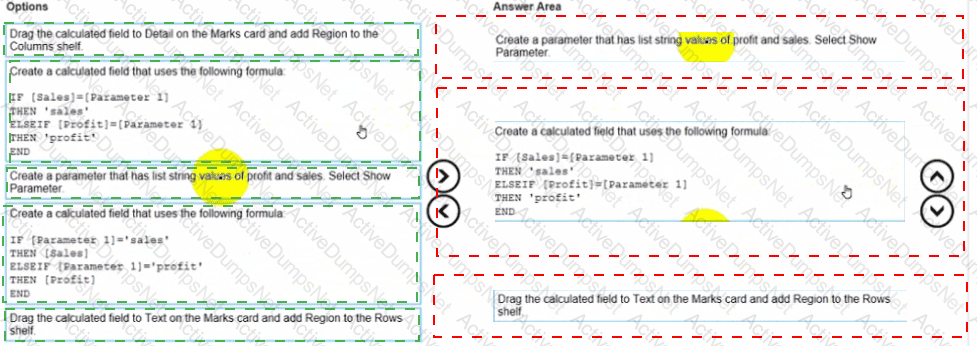
You have the following dataset.
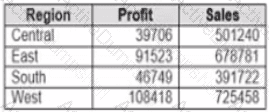
You need to create the following worksheet.
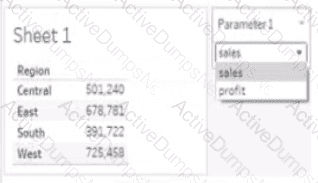
The table must show either profit or sales based on the selection from the Parameter 1 menu.
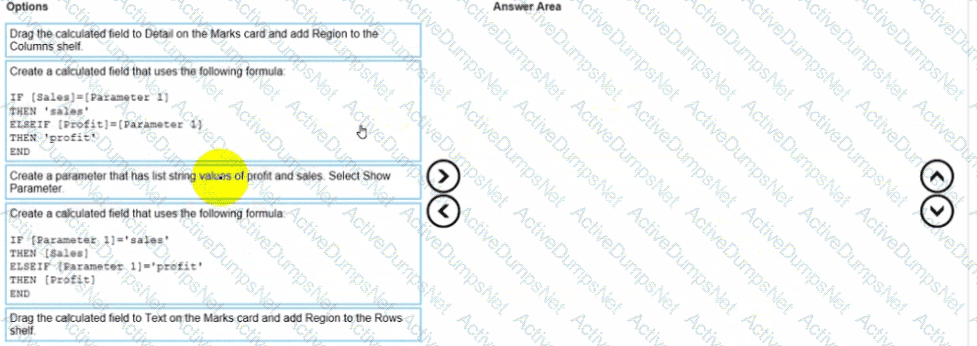
Which three actions should you perform in orders
(Place the three correct options in order Use the arrows to move Options lo Answer Area Use Answer Area arrows to reorder the options)
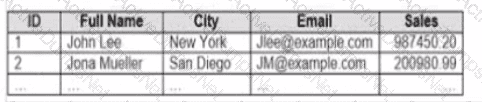
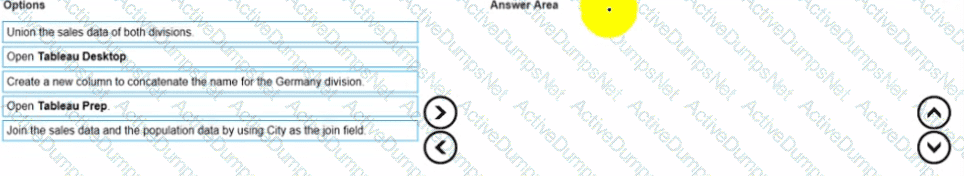
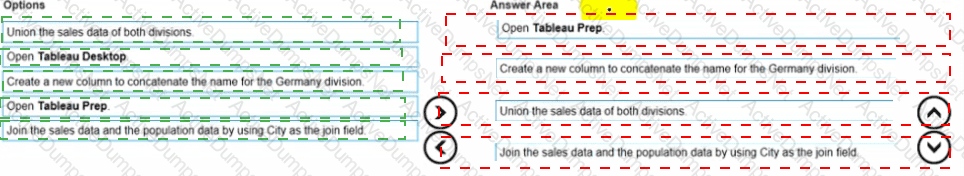
You company has two divisions located in the United States and Germany Bach division has a separate database. The following is a sample of the sales data for the division in the United States.
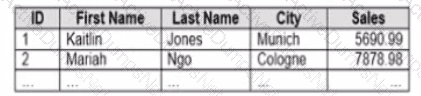
The following is a sample of the sales data for me division in Germany.
You have population data in a file named Populatio.csv. the following is a sample of the data.
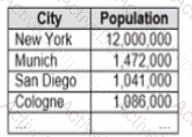
You plan to create a visualization that ml show tie sales per capita for each salesperson Each salesperson must be identified by identified by their full name.
You need to prepare the data to support the planned visualization. The data source must support being published .
Which four actions should you perform in order?
(Place the four correct options n order Use the arrows to move Options to Answer Area arrows to re-order the options.
Use Answer Area arrows to re-order the options)
You have the following dataset.
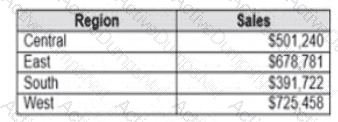
Which Level of Detail (LOD) expression should you use to calculate tie grand total of all the regions?
You have the following data source in tableau Server.
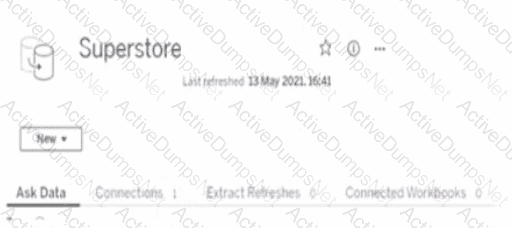
You need to ensure that the data is updated every hour.
What should you select?
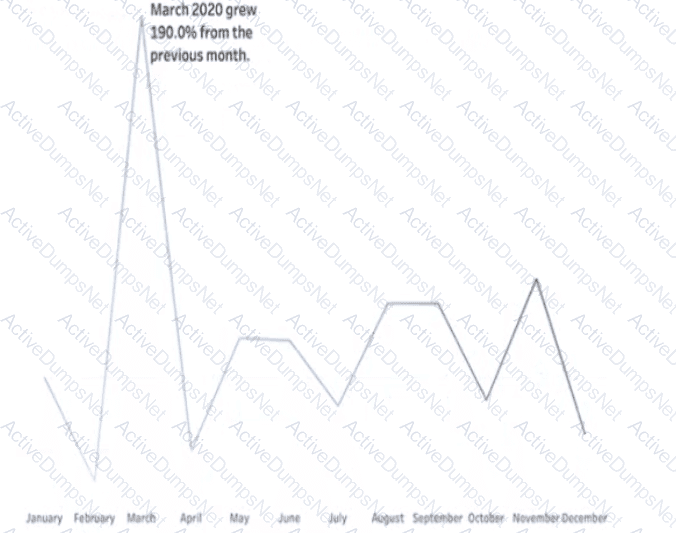
You have a line chart on a worksheet.
You want to add a comment to March 2020 as shown in the following visualization.
What should you do?
A colleague provides you with access to a folder that contains the following files:
• Sates.csv
• Bookl.twb
• Sates.hyper
• Export.mdb
Which He contains an extract?
You have the following box plot that shows the distribution of average profits made in every state by region.
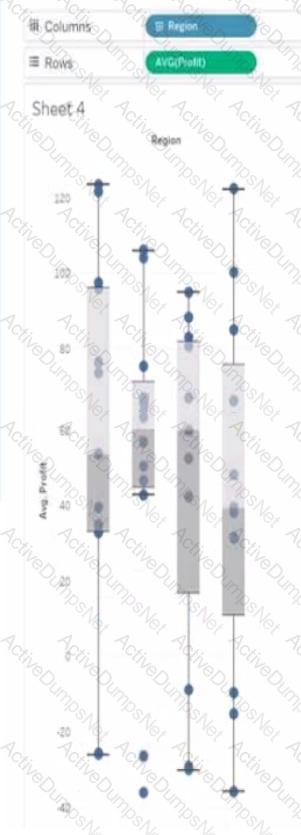
Which region has the smallest distribution of profits?
You have the following tiled dashboard that has one sheet.
You want to replace the sheet with Sheet2.
What should you do?
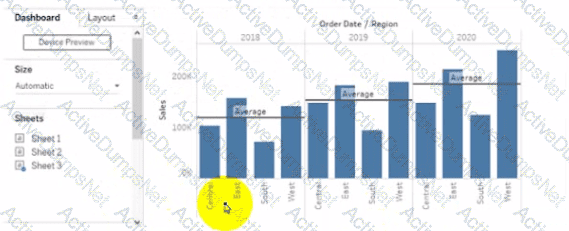
You have the Mowing dashboard.
Which two elements are floating? Choose two.
You have the following line chart that shows the average sales by month.
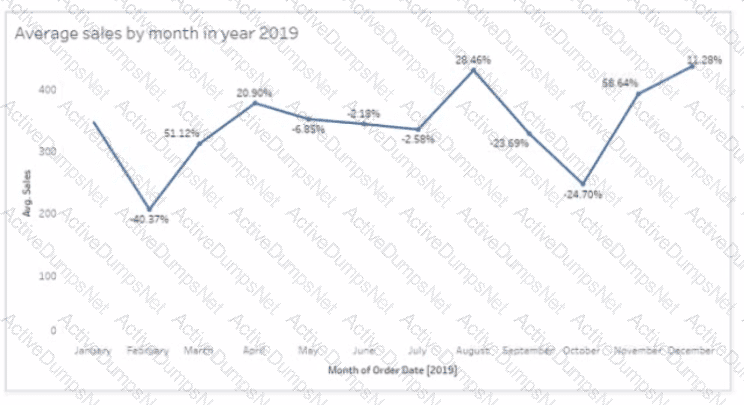
Which month had the biggest increase in swage sales compared to me previous month in 2019?
You have a dashboard that contains confidential information about patients health. The data needs to always be up to date tor a team of healthcare workers How should you share me dashboard with the healthcare workers?
You are the owner of an alert.
You receive an email notification that the alert was suspended
From where can you resume the suspended alert?
You publish a dashboard tut uses an attract. The extract refreshes every Monday at 10:00.
You need to ensure that the extract also refreshes on the last day of the month at 18:00.
What should you do?
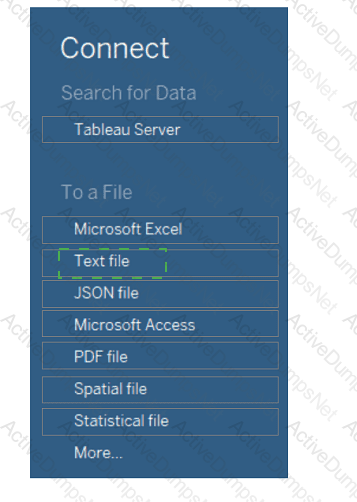
You want to connect a Tableau workbook to a dataset in a Microsoft Excel spreadsheet.
What should you do from Tableau Desktop?
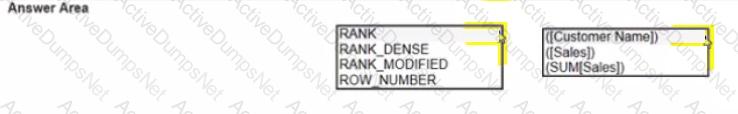
You have the following dataset.
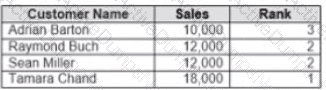
Yon need to calculate the ranking shown in the Rank field.
How should you complete the formula? (Use the dropdowns in the Answer Area to select the correct options to complete the formula ?

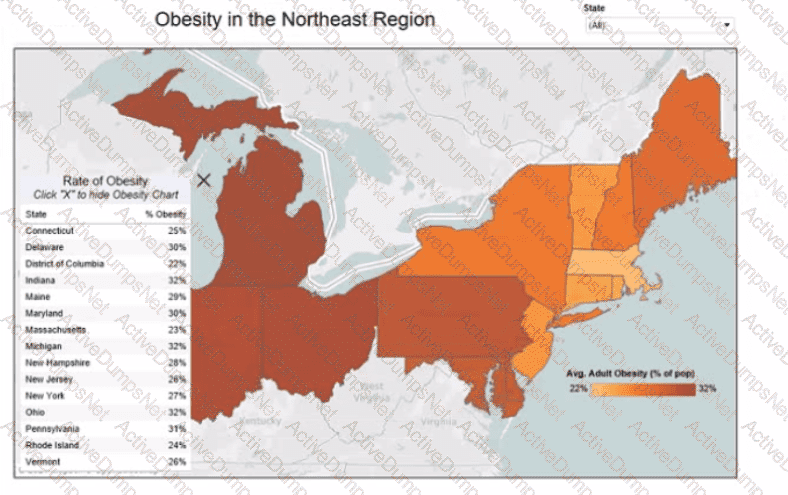
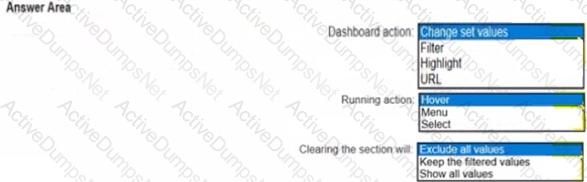
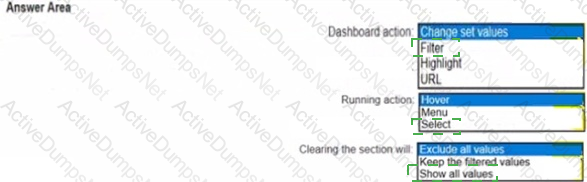
You have the following dashboard.
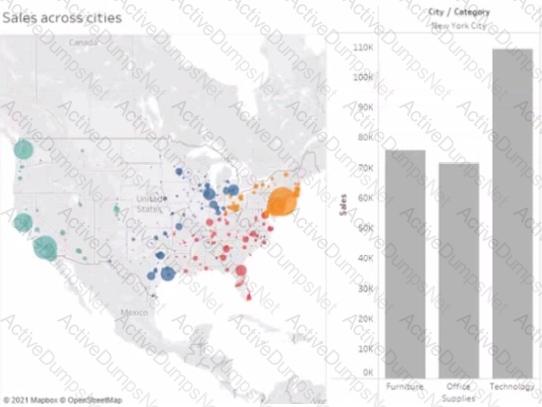
When a user selects a only on the map the data on the bar chart must show only the data for the selected city. The data in the bar chart must change only when the user selects a different city How should you configure the dashboard action? (Use the dropdowns in the Answers Area to select the correct options.)
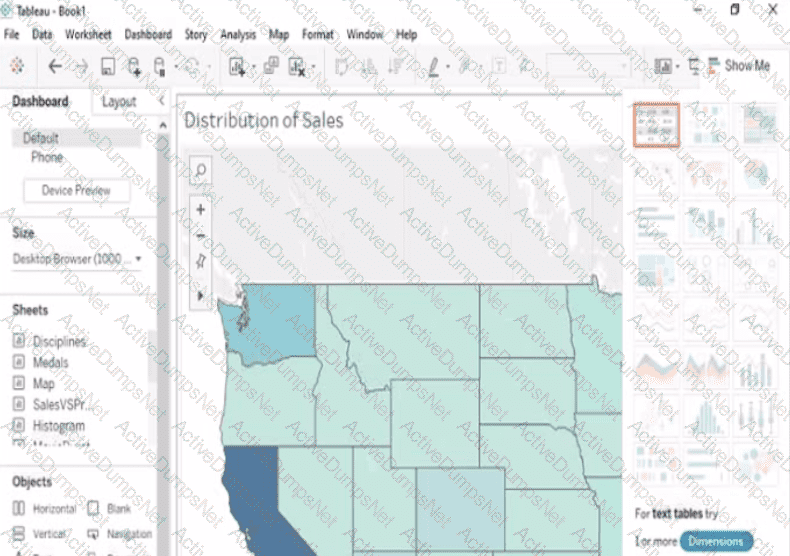
Open the Link to Book1 found on the desktop. Open Map worksheet and use Superstore data source.
Create a filed map to show the distribution of total Sales by State across the United States.
Open the link to Book1 found on the desktop. Use the Superstore data source.
Split the Customer Name field into two fields named First Name and Last Name.
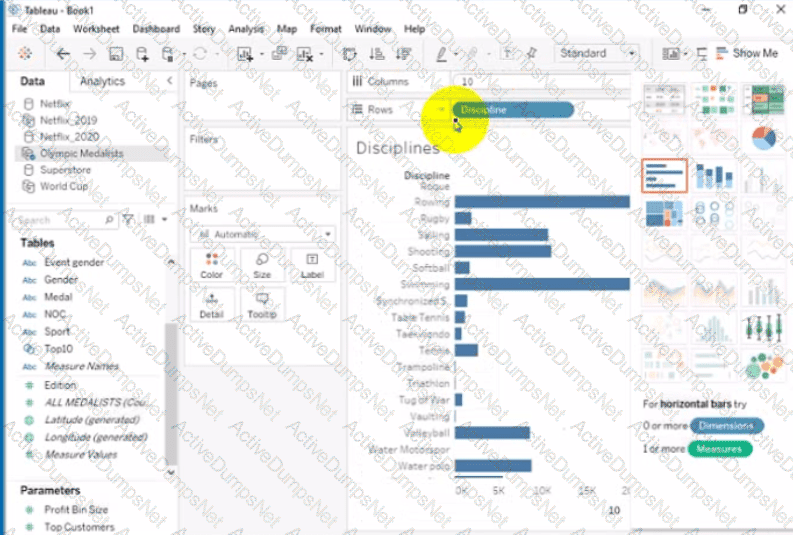
Open the link to Book1 found on the desktop. Open Disciplines worksheet.
Filter the table to show the members of the Top10 set and the members of the Bottom10 set. There should be a total of 20 rows.
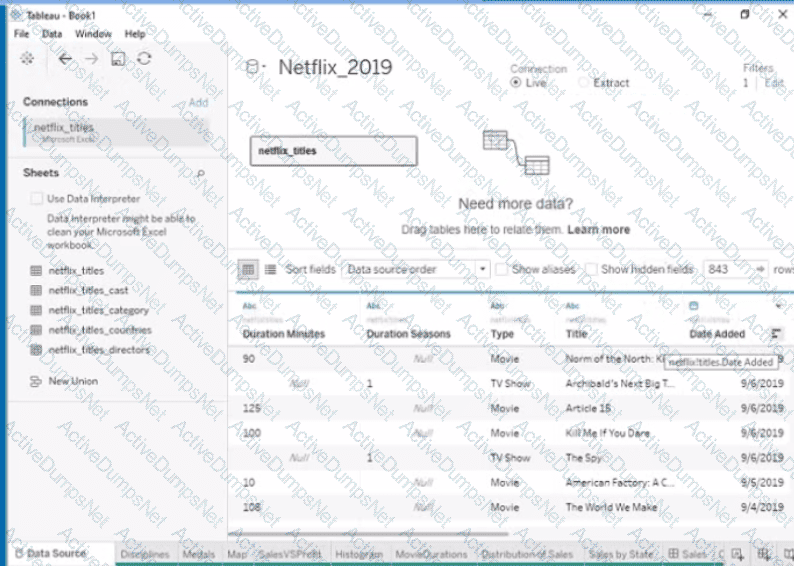
Open the link to Book1 found on the desktop. Open the Movie Durations worksheet.
Replace the existing data source with the Netflix_2019 data source.
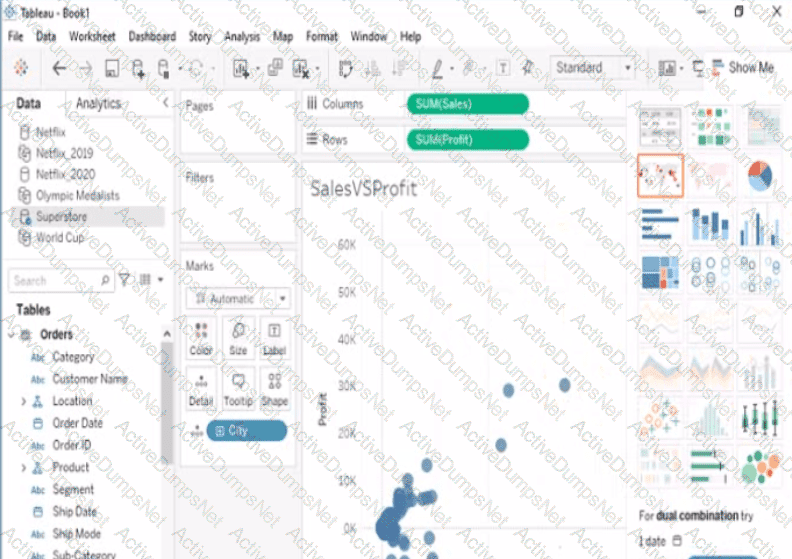
Open the link to Book1 found on the desktop. Open SalesVSProfit worksheet.
Add a distribution band on Profit to show the standard deviation from- 1 to 1.
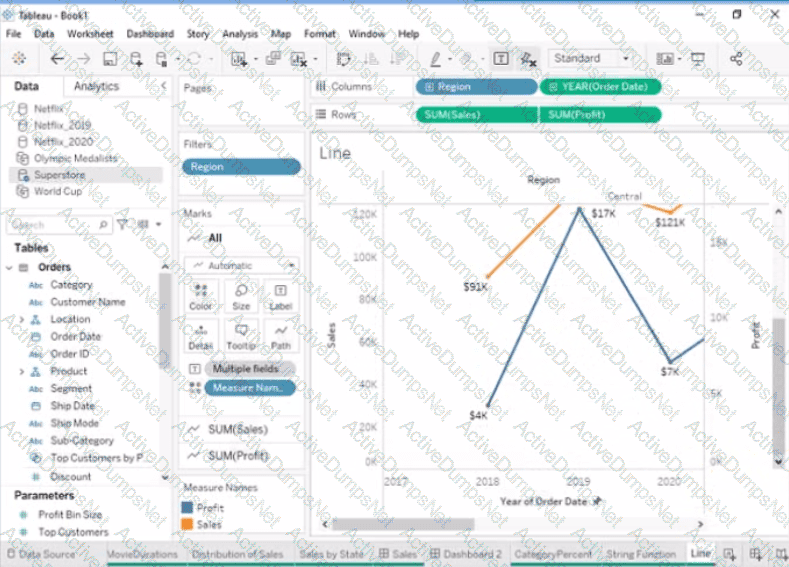
Open the link to Book1 found on the desktop. Open the Line worksheet.
Modify the chart to show only main and max values of both measures in each region.
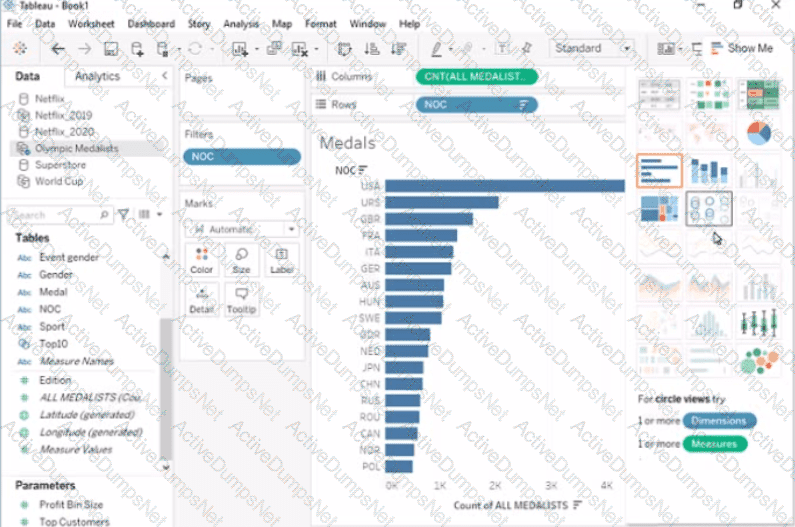
Open the link to Book1 found on the desktop. Open Disciplines worksheet.
Filter the table to show the Top 10 NOC based on the number of medals won.
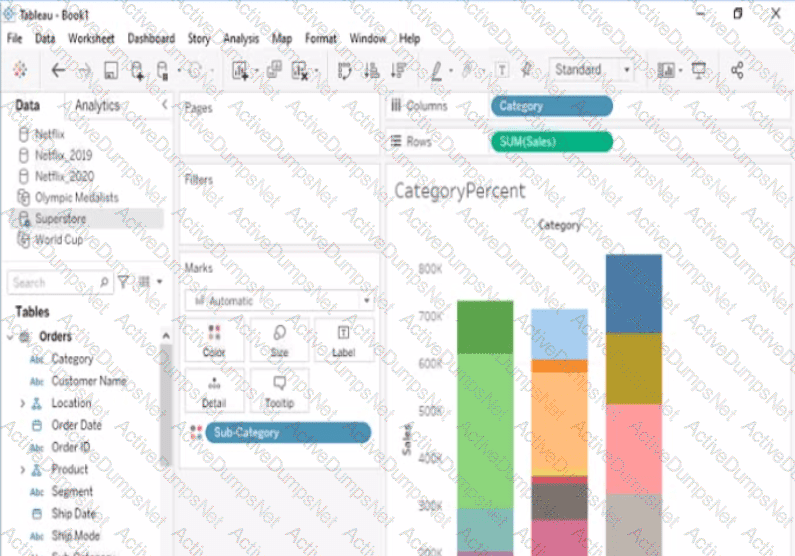
Open the link to Book1 found on the desktop. Open the CategoryPercentage worksheet.
Modify the bar chart show the percentage of sales for each Subcategory within every Category. The total percentage for every Category must be 100%.
Open the link to Book1 found on the desktop. Open the sales dashboard.
Add the Sales by State sheet in a Show/Hide button to the right side of the dashboard.

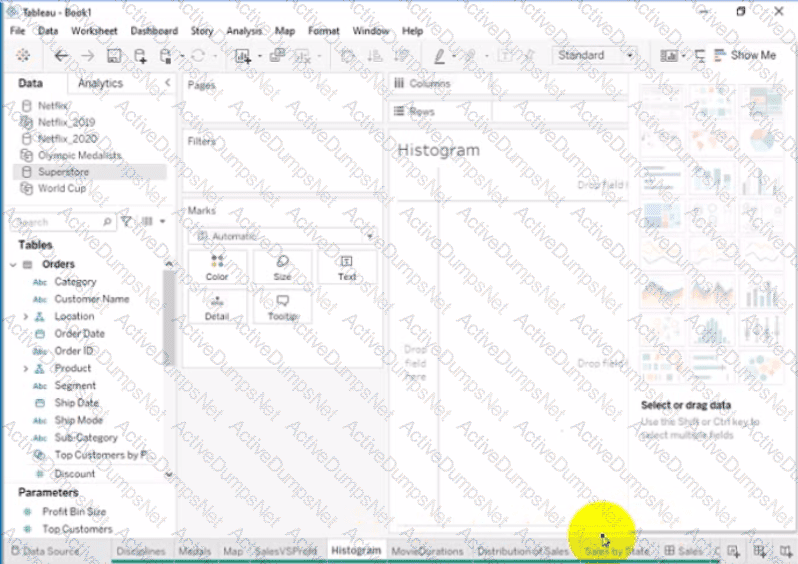
Open the link to Book1 found on the desktop. Open the Histogram worksheet and use the Superstone data source.
Create a histogram on the Quantity field by using bin size of 3.
A Data Analyst has received a request to provide a dashboard related to employee time logs. The employees are entering their time using mobile devices throughout the day and data is stored in a cloud-based database. The end users would like to receive data on their dashboard in as close to real-time as possible.
How should the analyst best create a data source to meet these requirements?
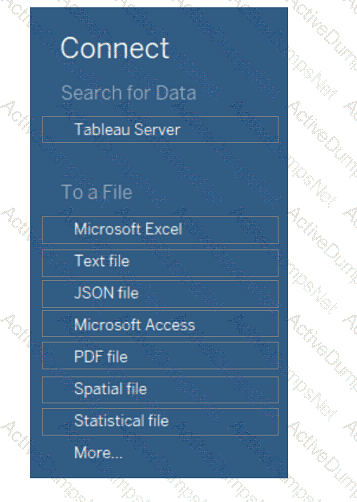
You receive a tab-delimited data file name sales.tsv.
You need to connect to the file.
Which option should you select in Tableau Desktop?
A Data Analyst has a website that displays data in a table format.
The analyst wants to connect to the data of the website by using the least amount of effort.
What should the analyst use to connect to the data?
A Data Analyst has created a Tableau Prep flow that is ready to be used. The output will be used by a colleague to build a dashboard on Tableau Cloud or Tableau Server.
Where should the analyst output the data to?
You have the following bar chart.
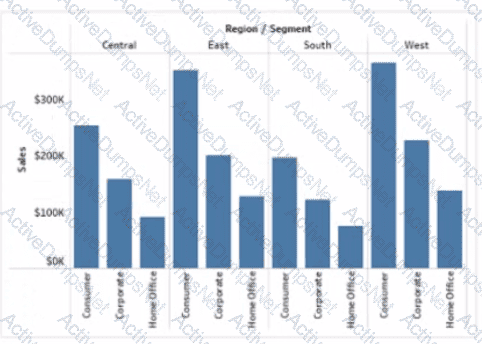
You want the chart to appear as shown in the Mowing exhibit.
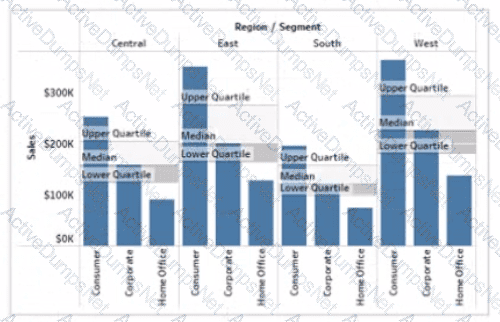
What should you add?
How should a Data Analyst sort data by Sales across multiple dimensions in Tableau?
A Data Analyst has a large data source that contains more than 10 million rows. Users can filter the rows by a field named Animal.
The following is a sample of the data.
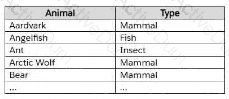
The analyst wants to ensure that every calculation is affected by including only animals of a particular type.
Which type of filter should the analyst create on the worksheet?
Which attributes are required for the field that is used to hide or show an object with Dynamic Zone Visibility?