Salesforce Analytics-Con-301 Salesforce Certified Tableau Consultant Exam Practice Test
Salesforce Certified Tableau Consultant Questions and Answers
A company has a data source for sales transactions. The data source has the following characteristics:
. Millions of transactions occur weekly.
. The transactions are added nightly.
. Incorrect transactions are revised every week on Saturday.
· The end users need to see up-to-date data daily.
A consultant needs to publish a data source in Tableau Server to ensure that all the transactions in the data source are available.
What should the consultant do to create and publish the data?
A client has a published data source in Tableau Server and they want to revert to the previous version of the data source. The solution must minimize the impact
on users.
What should the consultant do to accomplish this task?
A client builds a dashboard that presents current and long-term stock measures. Currently, the data is at a daily level. The data presents as a bar chart that
presents monthly results over current and previous years. Some measures must present as monthly averages.
What should the consultant recommend to limit the data source for optimal performance?
A consultant wants to improve the performance of reports by moving calculations to the data layer and materializing them in the extract.
Which calculation should the consultant use?
An executive-level workbook leverages 37 of the 103 fields included in a data source. Performance for the workbook is noticeably slower than other workbooks
on the same Tableau Server.
What should the consultant do to improve performance of this workbook while following best practice?
A client notices that while creating calculated fields, occasionally the new fields are created as strings, integers, or Booleans. The client asks a consultant if
there is a performance difference among these three data types.
What should the consultant tell the customer?
A client creates a report and publishes it to Tableau Server where each department has its own user group set on the server. The client wants to limit visibility of
the report to the sales and marketing groups in the most efficient manner.
Which approach should the consultant recommend?
A client collects information about a web browser customers use to access their website. They then visualize the breakdown of web traffic by browser version.
The data is stored in the format shown below in the related table, with a NULL BrowserID stored in the Site Visitor Table if an unknown browser version
accesses their website.

The client uses "Some Records Match" for the Referential Integrity setting because a match is not guaranteed. The client wants to improve the performance of
the dashboard while also getting an accurate count of site visitors.
Which modifications to the data tables and join should the consultant recommend?
A client wants to see the average number of orders per customer per month, broken down by region. The client has created the following calculated field:
Orders per Customer: {FIXED [Customer ID]: COUNTD([Order ID])}
The client then creates a line chart that plots AVG(Orders per Customer) over MONTH(Order Date) by Region. The numbers shown by this chart are far higher
than the customer expects.
The client asks a consultant to rewrite the calculation so the result meets their expectation.
Which calculation should the consultant use?
A client notices that several groups are sharing content across divisions and are not complying with their data governance strategy. During a Tableau Server
audit, a consultant notices that the asset permissions for the client's top-level projects are set to "Locked," but that "Apply to Nested Projects" is not checked.
The consultant recommends checking "Apply to Nested Projects" to enforce compliance.
Which impact will the consultant's recommendation have on access to the existing nested projects?
A client wants to use a bar chart to visualize the trend in profit per quarter for the last 5 years. They want each bar's color to be determined by whether the profit during that quarter was greater than the median profit for the past four quarters, including the current quarter.
For example, if a bar represents profit for 2020 Q4, they want to visually see whether the profit for 2020 Q4 is greater than the median profit for 2020 Q1–2020 Q4.
Which table calculation should produce the desired result?
A client's dashboard has two sections dedicated to their shops and warehouses shown when a viewer chooses either shops or warehouses with a parameter.
There are a few quick filters that apply to both, while others apply to only shops or only warehouses.
Currently, the quick filters are all shown at the left side of the dashboard. The client wants to hide all filters, but when shown, make it easy for the viewer to
find the quick filters that work for only shops or only warehouses.
Which solution should the consultant recommend that meets the client's needs and is most user-friendly?
A client has a database that stores widget inventory by day and it is updated on a nonstandard schedule as shown below.
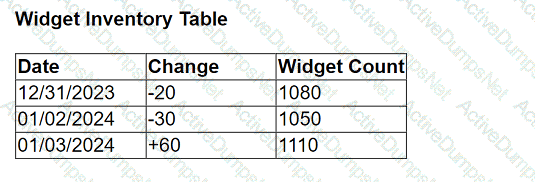
They want a data visualization that shows widget inventory daily, however their business unit does not have the ability to modify the data warehouse
structure.
What should the client do to achieve the desired result?
A client has a sales dataset that contains fields named Customer ID, Region, Item, and Sales Amount. Each row represents a single sale. There may be multiple sales for each Customer ID.
The client wants to visualize the average total customer sales by region.
Which Level of Detail (LOD) expression should a consultant recommend?
A performance recording of a workbook shows that a query to an extracted data source is taking too long.
Which area should the consultant focus on optimizing if "Executing Query" is taking a long time?
A client has a data source that stores a time stamp for each time a user interacts with a product feature. They visualize 3 years of data at the daily level. As adoption has grown over the last 6 months, the dashboard performance has steadily decreased, despite connecting via a data extract that is set to refresh every hour.
A Tableau consultant needs to improve performance of the dashboard with the least impact to the visualization.
Which option meets these requirements without additional cost?
A client wants to count all the distinct orders placed in 2010. They have written the following calculation, but the result is incorrect.
IF YEAR([Date])=2010 THEN COUNTD ([OrderID]) END
Which calculation will produce the correct result?
A client wants to view stores serviced by delivery drivers on a map. The have the information provided in the table below:
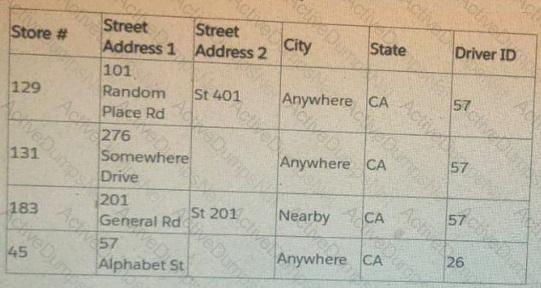
What does the client need to do to plot exact street addresses on the map?
A consultant has a view using a table calculation to calculate percent of total Sales by Category. The consultant would like to filter out particular categories, but wants the percent of total calculation to remain steady even as they filter items in or out.
What should the consultant do to achieve the desired impact?
A client calculates the percent of total sales for a particular region compared to all regions.
The Sales percentage is inadvertently recalculated each time the filter is applied to the Region.

Which calculation should fix the automatic recalculation on the % of total field?
From the desktop, open the CC workbook.
Open the City Pareto worksheet.
You need to complete the Pareto chart to show the percentage of sales compared to the percentage of cities. The chart must show references lines to visualize how the data compares to the Pareto principle.
From the File menu in Tableau Desktop, click Save.
From the desktop, open the CC workbook.
Open the Manufacturers worksheet.
The Manufacturers worksheet is used to
analyze the quantity of items contributed by
each manufacturer.
You need to modify the Percent
Contribution calculated field to use a Level
of Detail (LOD) expression that calculates
the percentage contribution of each
manufacturer to the total quantity.
Enter the percentage for Newell to the
nearest hundredth of a percent into the
Newell % Contribution parameter.
From the File menu in Tableau Desktop, click
Save.
From the desktop, open the CC workbook.
Open the Incremental worksheet.
You need to add a line to the chart that
shows the cumulative percentage of sales
contributed by each product to the
incremental sales.
From the File menu in Tableau Desktop, click
Save.
From the desktop, open the CC workbook. Use the US Population Estimates data source.
You need to shape the data in US Population Estimates by using Tableau Desktop. The data must be formatted as shown in the following table.
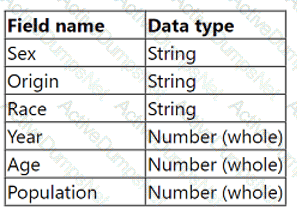
Open the Population worksheet. Enter the total number of records contained in the data set into the Total Records parameter.
From the File menu in Tableau Desktop, click Save.
From the desktop, open the NYC
Property Transactions workbook.
You need to record the performance of
the Property Transactions dashboard in
the NYC Property Transactions.twbx
workbook. Ensure that you start the
recording as soon as you open the
workbook. Open the Property
Transactions dashboard, reset the filters
on the dashboard to show all values, and
stop the recording. Save the recording in
C:\CC\Data\.
Create a new worksheet in the
performance recording. In the worksheet,
create a bar chart to show the elapsed
time of each command name by
worksheet, to show how each sheet in
the Property Transactions dashboard
contributes to the overall load time.
From the File menu in Tableau Desktop,
click Save. Save the performance
recording in C:\CC\Data\.
Use the following login credentials to sign in
to the virtual machine:
Username: Admin
Password:
The following information is for technical
support purposes only:
Lab Instance: 40201223
To access Tableau Help, you can open the
Help.pdf file on the desktop.
From the desktop, open the CC workbook.
Open the Categorical Sales worksheet.
You need to use table calculations to
compute the following:
. For each category and year, calculate
the average sales by segment.
. Create another calculation to
compute the year-over-year
percentage change of the average
sales by category calculation. Replace
the original measure with the year-
over-year percentage change in the
crosstab.
From the File menu in Tableau Desktop, click
Save.