- Home
- Microsoft
- Microsoft Certified: Power BI Data Analyst Associate
- PL-300
- PL-300 - Microsoft Power BI Data Analyst
Microsoft PL-300 Microsoft Power BI Data Analyst Exam Practice Test
Microsoft Power BI Data Analyst Questions and Answers
You need to minimize me size of the dataset. The solution must meet the report requirements What should you do?
Options:
Change lite OrderlD column in the Orders table to the text data type.
Filter out discontinued products while importing the Product table.
Remove the QuantityPerUnit column from the Products table
Group the Categories table by the CategorylD column.
Answer:
CYou need to create the semantic model.
Which storage mode should you use for the tables in the semantic model?
Options:
live connection
Dual
Import
DirectQuery
Answer:
CYou use Power Query to import two tables named Order Header and Order Details from an Azure SQL database. The Order Header table relates to the Order Details table by using a column named Order ID in each table.
You need to combine the tables into a single query that contains the unique columns of each table.
What should you select in Power Query Editor?
Options:
Merge queries
Append queries
Combine files
Answer:
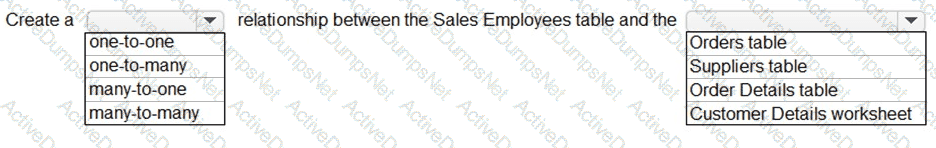
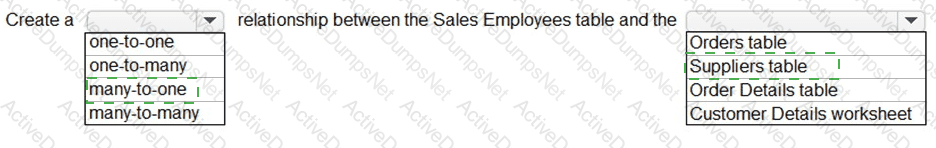
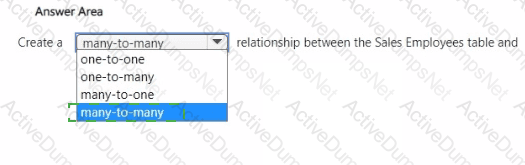
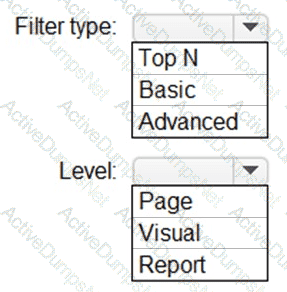
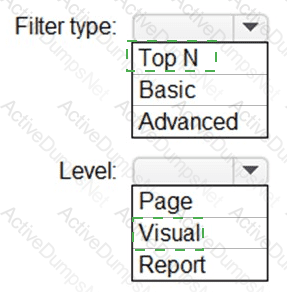
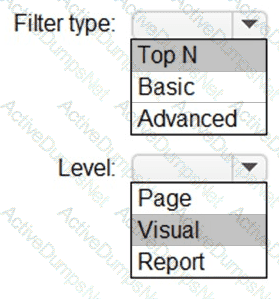
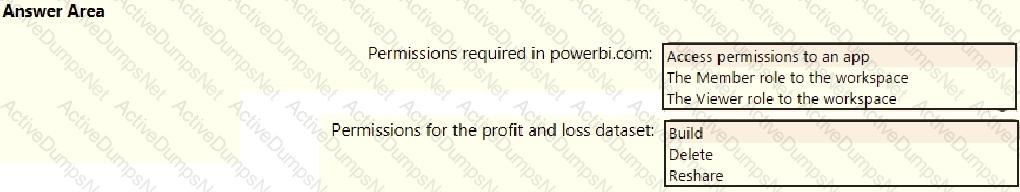
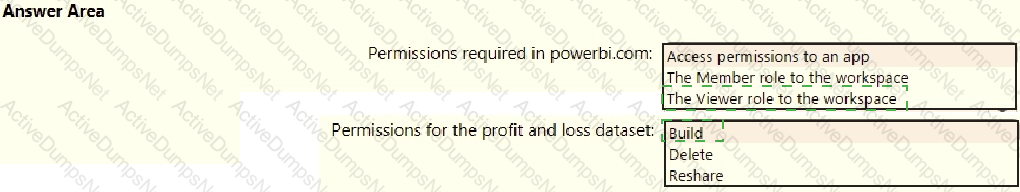
AYou need to create a relationship in the dataset for RLS.
What should you do? To answer, select the appropriate options in the answer area.
NOTE: Each correct selection is worth one point.
Options:
Answer:
Explanation:
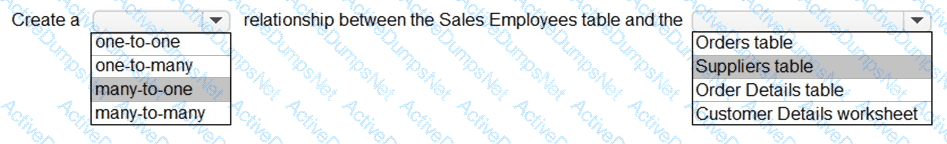
Box 1: many-to-one
Each employee in the Sales Employees table is assigned to one sales region. Multiple employees can be assigned to each region.
The Suppliers table has a Region column.
Box 2: Suppliers table
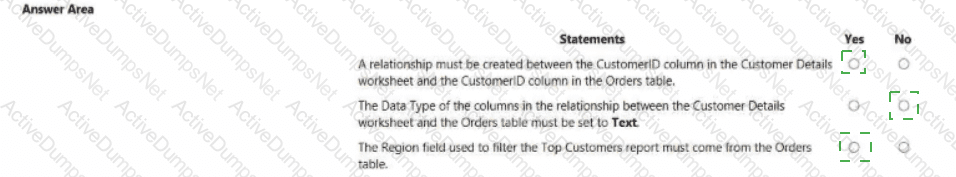
You need to create a relationship in the data model for RLS.
What should you do? To answer, select the appropriate options in the answer area.
NOTE: Each correct selection is worth one point.

Options:
Answer:
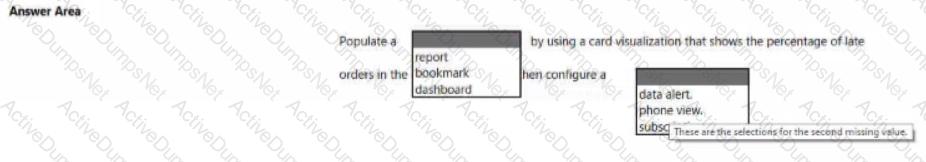
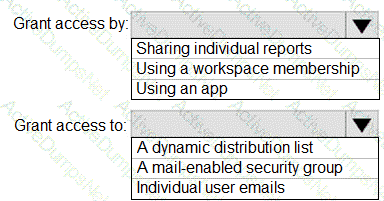
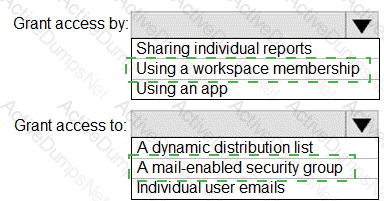
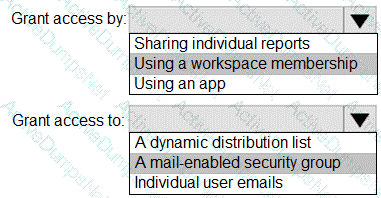
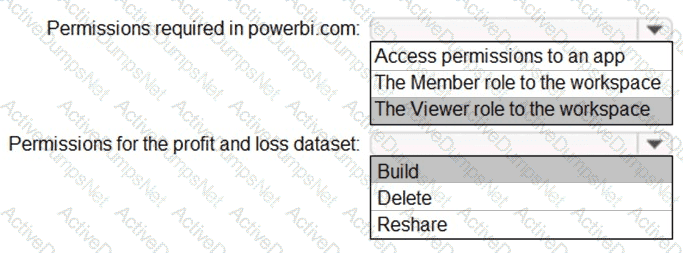
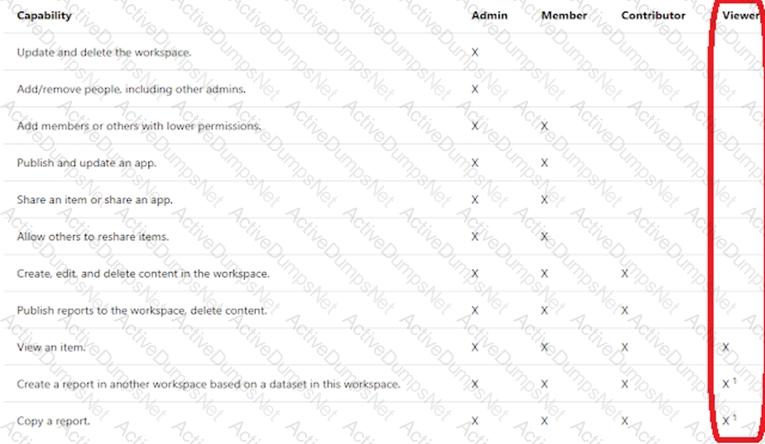
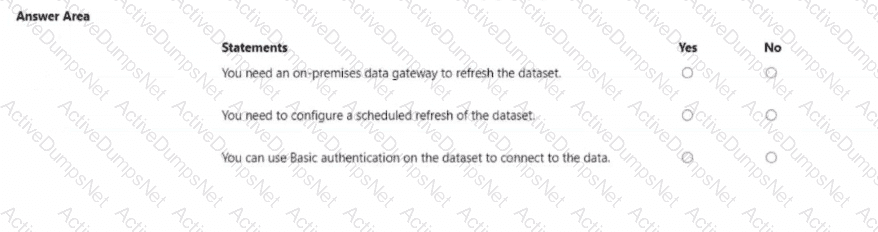
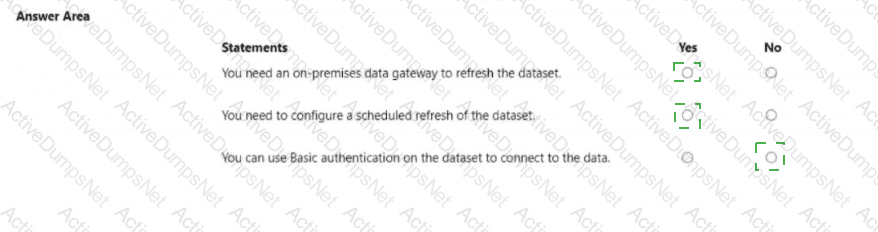
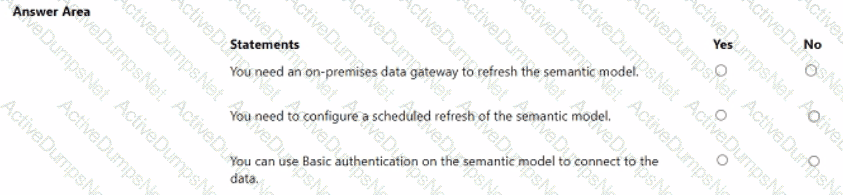
You need to create a solution to meet the notification requirements of the warehouse shipping department.
What should you do? To answer, select the appropriate options in the answer area.
NOTE: Each correct select is worth one point:
Options:
Answer:

You need to create the dataset. Which dataset mode should you use?
Options:
DirectQuery
Import
Live connection
Composite
Answer:
DExplanation:
Composite Model means now you can have a model, that very large tables of that are coming from the DirectQuery connection, without the need for importing, and small tables to be imported to be accessible quickly.
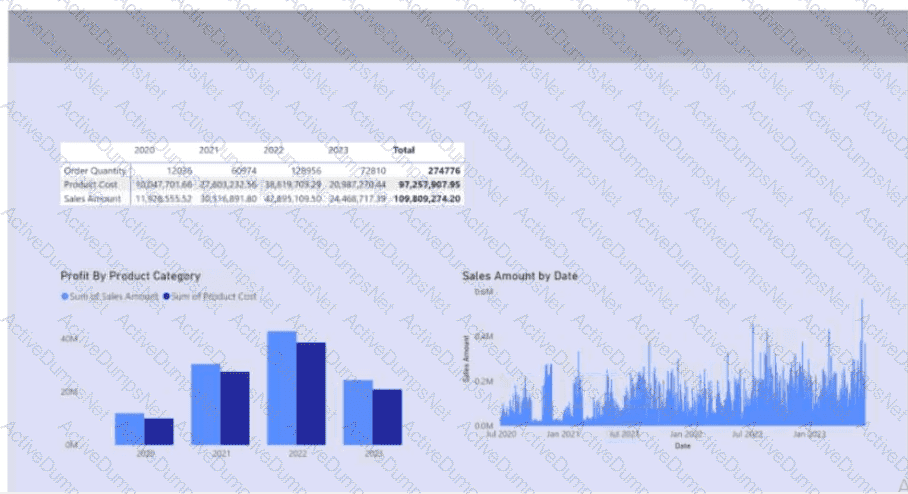
You need to minimize the size of the semantic model. The solution must meet the report requirements.
What should you do?
Options:
Filter out discontinued products while importing the Products table.
Group the Categories table by the CategorylD column.
Change the OrderlD column in the Orders table to the Text data type.
Remove the QuantityPerUnit column from the Products table.
Answer:
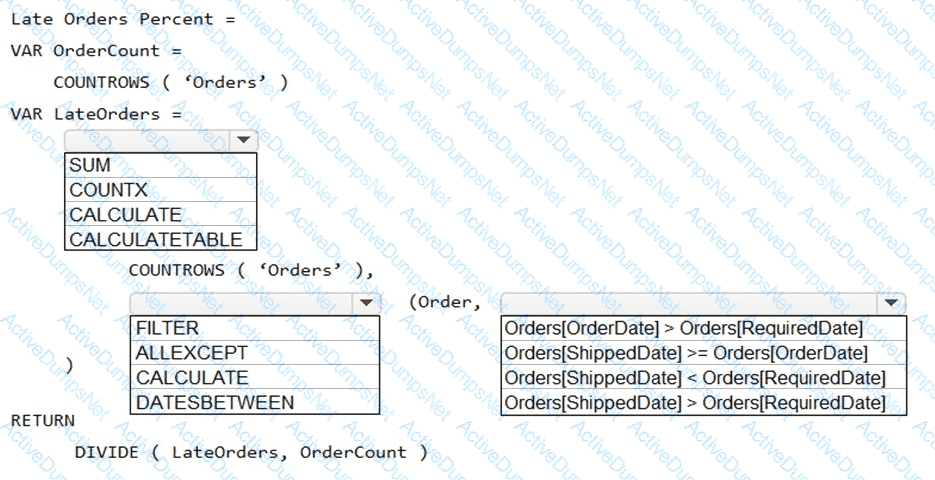
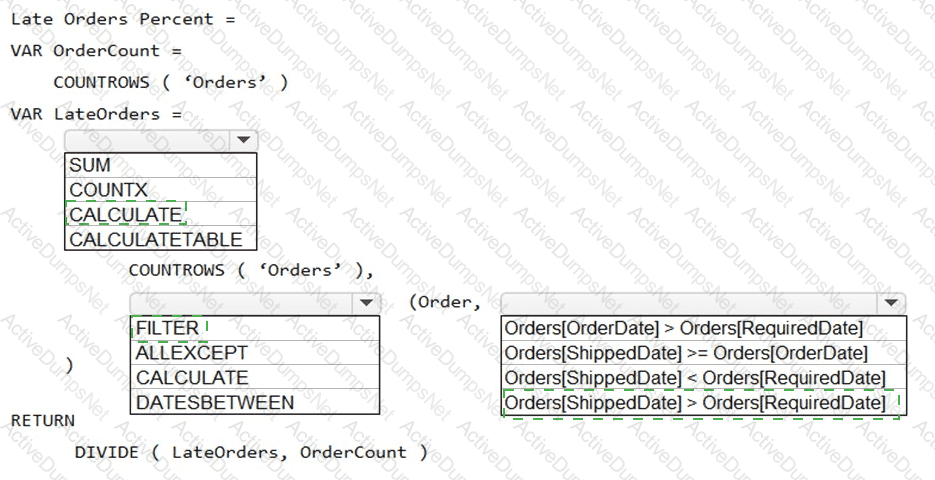
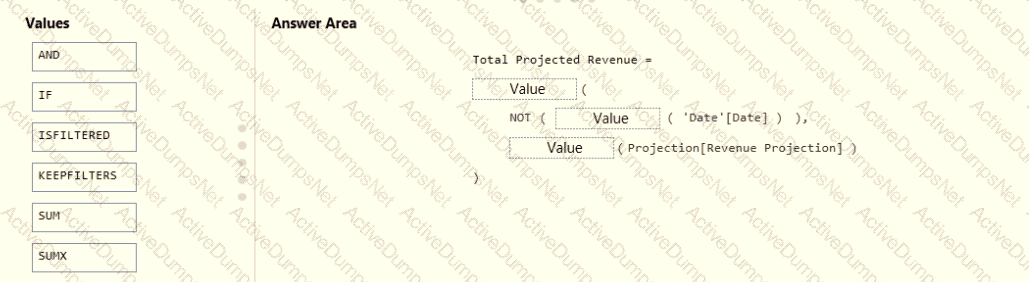
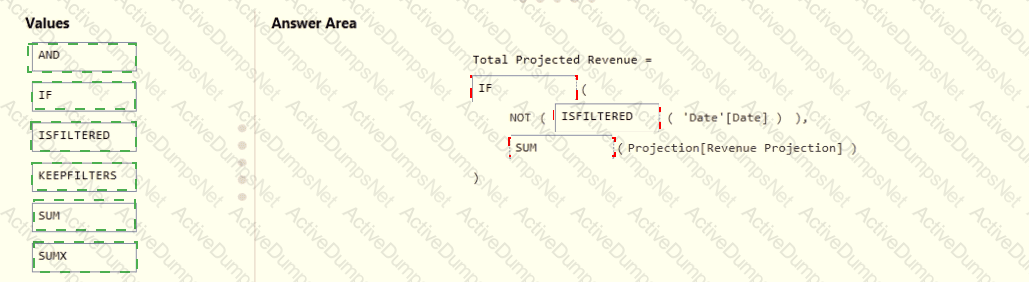
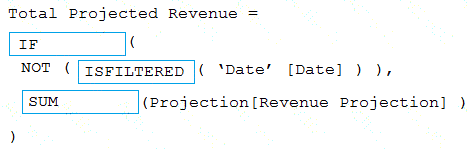
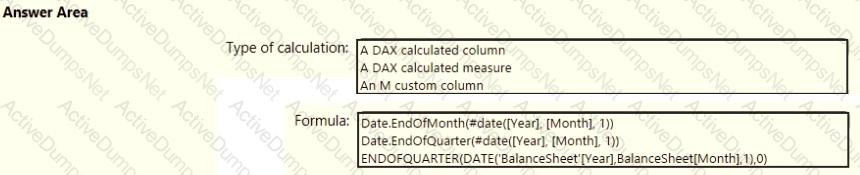
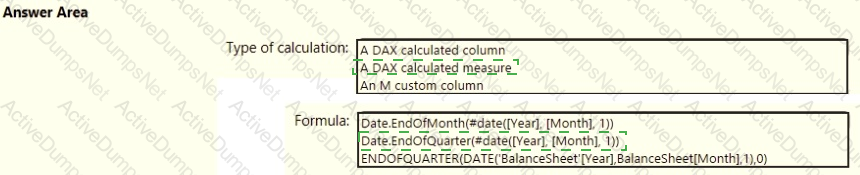
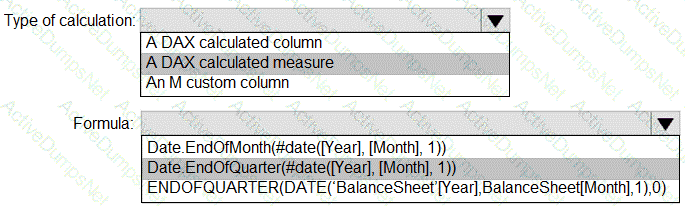
DYou need to create a measure that will return the percentage of late orders.
How should you complete the DAX expression? To answer, select the appropriate options in the answer area.
NOTE: Each correct selection is worth one point.
Options:
Answer:
Explanation:
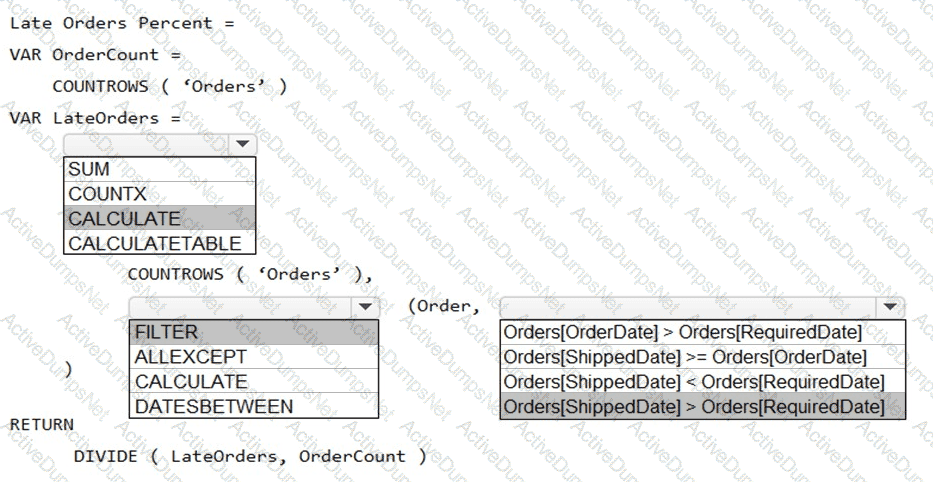
Box 1: CALCULATE
CALCULATE evaluates an expression in a modified filter context.
Syntax: CALCULATE(
Expression - The expression to be evaluated.
filter1, filter2,… (Optional) Boolean expressions or table expressions that defines filters, or filter modifier functions.
Box 2: FILTER
FILTER returns a table that represents a subset of another table or expression.
Syntax: FILTER(

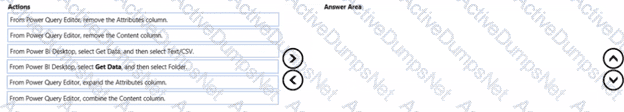


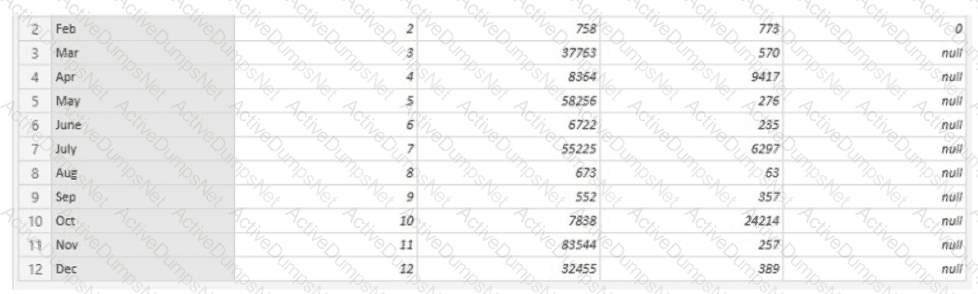
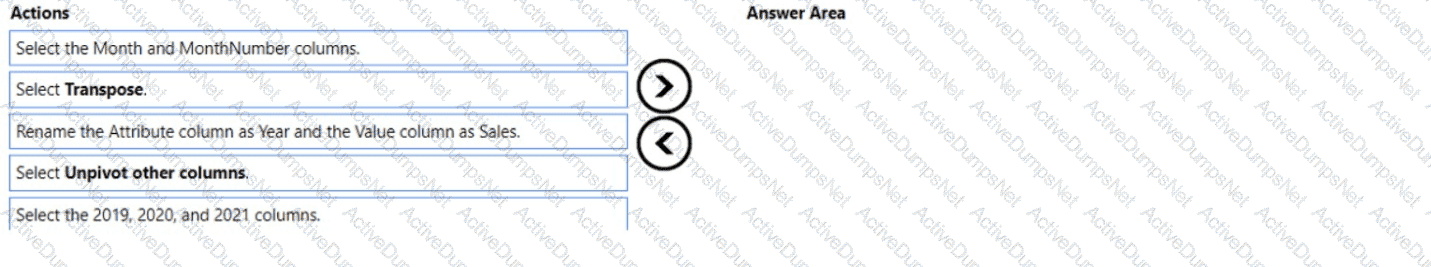
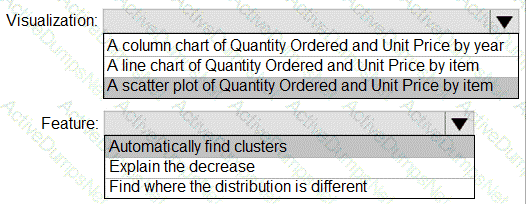
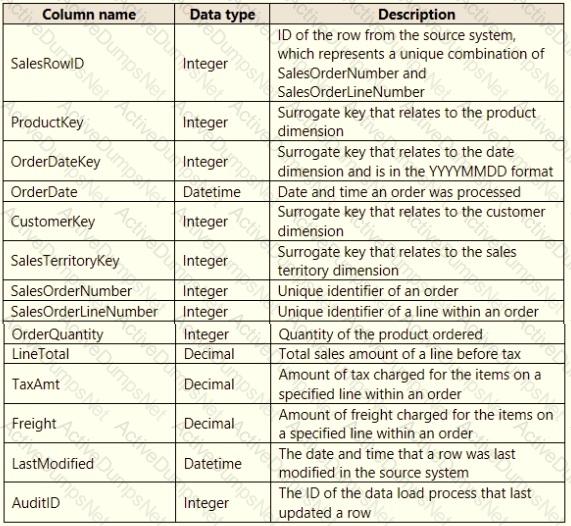
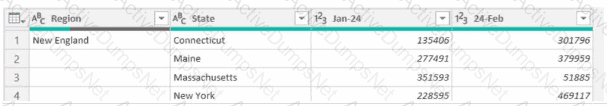
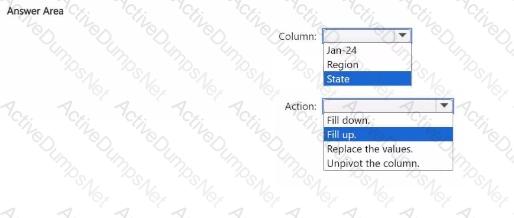
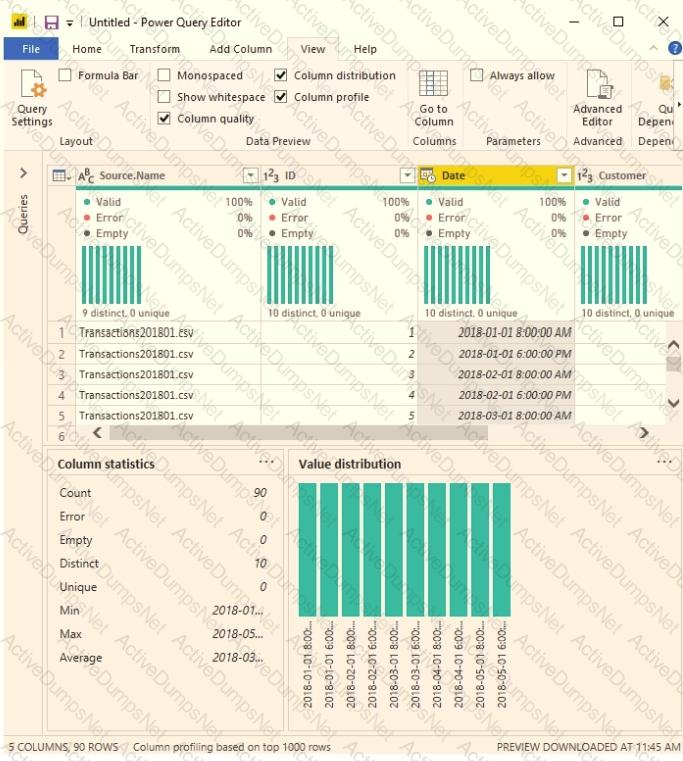
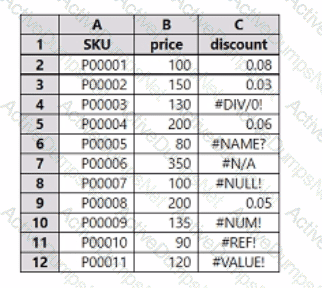
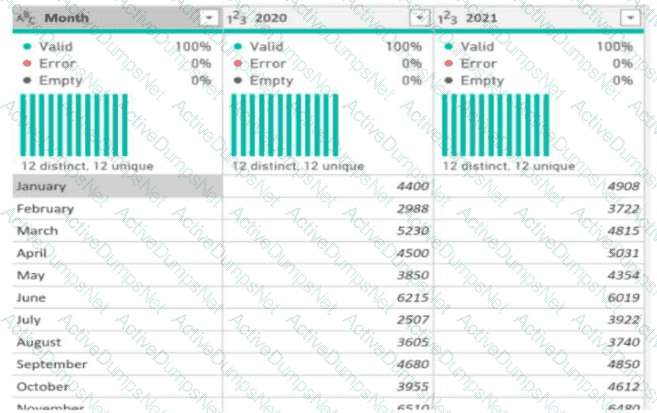 You need to shape the query to display the following three columns: