Fortinet FCP_FAZ_AN-7.6 Fortinet NSE 5 - FortiAnalyzer 7.6 Analyst Exam Practice Test
Fortinet NSE 5 - FortiAnalyzer 7.6 Analyst Questions and Answers
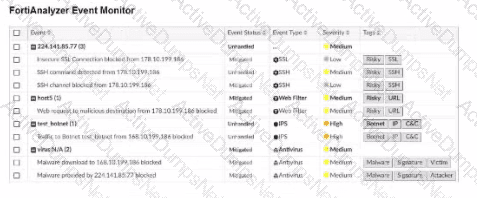
Exhibit.
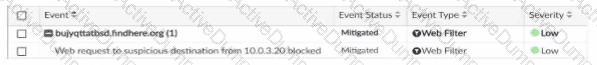
Which statement about the event displayed is correct?
(You created a playbook on FortiAnalyzer that uses a FortiOS connector. When you configure FortiGate, which type of trigger must you use so that the actions in an automation stitch are available in the FortiOS connector? (Choose one answer)
Refer to Exhibit:
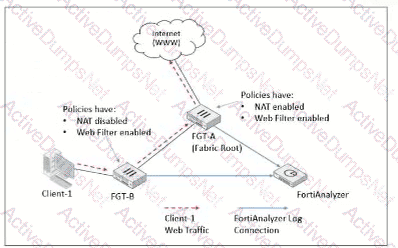
Client-1 is trying to access the internet for web browsing.
All FortiGate devices in the topology are part of a Security Fabric with logging to FortiAnalyzer configured. All firewall policies have logging enabled. All web filter profiles are configured to log only violations.
Which statement about the logging behavior for this specific traffic flow is true?
Which two statements regarding FortiAnalyzer operating modes are true? (Choose two.)
Refer to the exhibit.

What can you conclude from this output? (Choose one answer)
What happens when the indicator of compromise (IOC) engine on FortiAnalyzer finds web logs that match blacklisted IP addresses?
Which statement about automation connectors in FortiAnalyzer is true?
After generating a report, you notice the information you were expecting to see is not included in it. However, you confirm that the logs are there.
Exhibit.
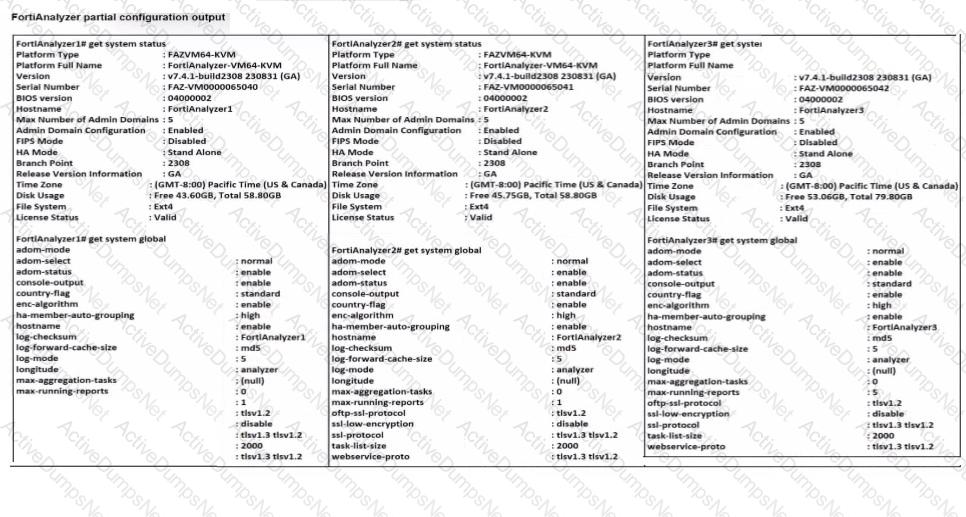
Based on the partial outputs displayed, which devices can be members of a FortiAnalyzer Fabric?
(An analyst is using FortiAI on FortiAnalyzer to simplify certain tasks but is worried about exceeding the monthly token limit. Which query will take the fewest FortiAI tokens? (Choose one answer)
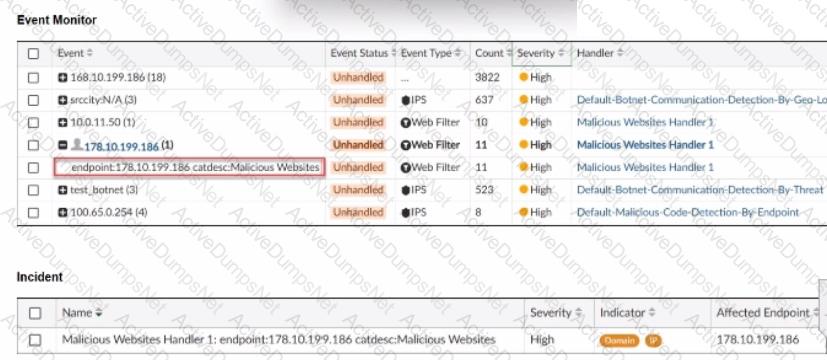
(Refer to the exhibit.
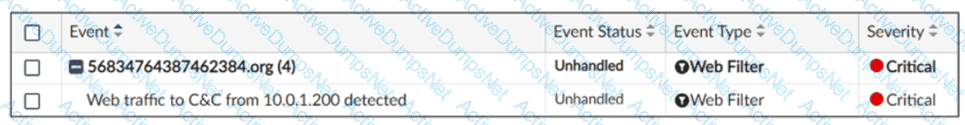
Which statement about the displayed event is correct? (Choose one answer)
Which statement about the FortiSOAR management extension is correct?
Which two statements about local logs on FortiAnalyzer are true? (Choose two.)
You need to move reports between two ADOMs.
Which two statements are true? (Choose two.)
Which statement about SQL SELECT queries is true?
Which statement regarding macros on FortiAnalyzer is true?
Refer to the exhibits.
The event shown in the exhibit has been escalated to an incident.
Which SOC role is responsible for handling the escalated incident?
Why must you wait for several minutes before you run a playbook that you just created?
Exhibit.
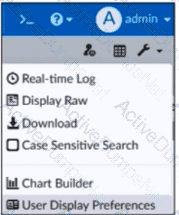
What is the purpose of using the Chart Builder feature on FortiAnalyzer?
Refer to Exhibit:
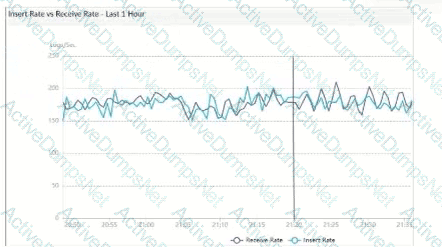
What does the data point at 21:20 indicate?
Exhibit.
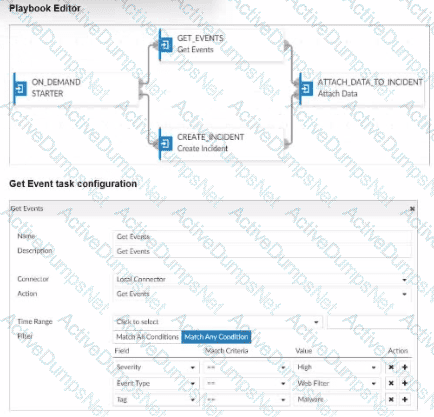
Assume these are all the events that exist on the FortiAnalyzer device.
How many events will be added to the incident created after running this playbook?
Which two statements about exporting and importing playbooks are true? (Choose two.)
A playbook contains five tasks in total. An administrator runs the playbook and four out of five tasks finish successfully, but one task fails.
What will be the status of the playbook after it is run?