- Home
- CrowdStrike
- CCFH
- CCFH-202b
- CCFH-202b - CrowdStrike Certified Falcon Hunter
CrowdStrike CCFH-202b CrowdStrike Certified Falcon Hunter Exam Practice Test
CrowdStrike Certified Falcon Hunter Questions and Answers
Which action helps identify an enterprise-wide file infection?
Options:
Monitor the Falcon Console for alerts on suspicious process activity
Analyze the Investigate Host dashboard to identify endpoints with high-risk file activity
Utilize CrowdStrike Query Language (CQL) to search for files with the same hashes that have been renamed
Utilize the IP addresses Investigate dashboard to find the hosts' processes that are connecting to an unusual IP
Answer:
CExplanation:
Identifying an enterprise-wide file infection requires a hunter to look past simple file names, which adversaries often randomize or mask to evade basic detection. The most effective Hunting Methodology for this scenario is to focus on the file's unique cryptographic hash (MD5, SHA256). Even if an attacker renames a malicious binary (e.g., from malware.exe to svchost.exe) to blend into different environments, the hash remains identical.
By utilizing CrowdStrike Query Language (CQL) in the Event Search or LogScale environments, a hunter can search for a known malicious hash across all ProcessRollup2 and ImageHash events. This allows the analyst to see every instance where that specific file has appeared, regardless of the local file name or path. This technique is particularly powerful for identifying "Polymorphic" behavior where the filename changes but the core payload stays the same. While monitoring alerts (Option A) is reactive and host dashboards (Option B) are localized, hash-based hunting provides a global, enterprise-wide perspective. This ensures that the hunter can identify every single "infected" host, including those where the malware may be dormant or where a local detection has not yet been triggered, enabling a comprehensive and simultaneous remediation effort across the entire organization.
A detection contains a suspicious process named "reallysus.exe". This process has a TargetProcessId of 123456789. Which query will return all of the events associated with this process?
Options:
TargetProcessId=123456789 OR ParentProcessId=123456789 OR RpcClientProcessId=123456789
#event_simpleName=ProcessRollup2 FileName=reallysus.exe
#event_simpleName=ProcessRollup2 TargetProcessId=123456789
TargetProcessId=123456789 OR ContextProcessId=123456789 OR RpcClientProcessId=123456789
Answer:
DExplanation:
In Event Search , correlating the full scope of a process's activity requires an understanding of the "Process ID Trinity." When the process reallysus.exe is executed, its primary identity is captured in a ProcessRollup2 event under the TargetProcessId . However, searching only for the TargetProcessId would merely return the process start record. To see the actions the process performed—such as connecting to a malicious IP or writing a persistence key—the hunter must also search for the ContextProcessId .
The ContextProcessId is used in all telemetry events generated by that process. Furthermore, for cross-process activity initiated via Remote Procedure Calls, the RpcClientProcessId may be involved. By using the OR operator to combine TargetProcessId, ContextProcessId, and RpcClientProcessId in a single query, the hunter ensures they are capturing the entire lifecycle: the creation of the process, every network/file/registry operation it performed, and its interactions with other system services. This comprehensive search strategy is fundamental to Search and Investigation Tools , as it allows for a seamless reconstruction of the adversary's timeline. Missing any of these identifiers would result in "blind spots" in the investigation, potentially hiding the most critical evidence of data exfiltration or lateral movement.
Which Investigate tool will show you which users have logged in to a particular server?
Options:
Search by agent ID
Host search
User Search
Bulk domains
Answer:
BExplanation:
The Host search (often accessed via the Host Investigate dashboard) is the primary "Host-Centric" investigation tool in the Falcon console. When an analyst enters a hostname or Agent ID (AID) into this tool, Falcon retrieves a consolidated view of that specific system's activity. One of the most critical sections of this dashboard is the Recent Logons list.
This view provides a chronological history of every user account—both local and domain—that has successfully authenticated to the host. For a hunter, this is an essential part of the Hunting Methodology for identifying "Credential Overlap" or unauthorized access. If an unusual administrative account or a service account that has no business being on that server is listed, it can indicate lateral movement (T1021). While User Search (Option C) allows you to see all the machines a specific user has touched, only Host search provides the "reverse" view: every user that has touched a specific machine . This allows the analyst to establish a baseline of "normal" users for a server (e.g., specific DBA accounts for a SQL server) and quickly spot anomalies that warrant a deeper dive into the UserLogon events in the Event Search.
While performing a threat hunt in your environment, you decide to identify rare occurrences of user agent strings over the past 30 days. Which query will highlight those results using CQL?
Options:
groupBy(UserAgentString, function=collect([ComputerName, UserName, LocalAddressIP4])) | min(field=UserAgentString, limit=10)
selectFromMin(field=UserAgentString, include=[ComputerName, UserName, LocalAddressIP4])
groupBy(UserAgentString, function=[collect([ComputerName, UserName, LocalAddressIP4]), count()] ) | sort(_count, order=asc, limit=10)
tail(field=UserAgentString, limit=10, include=[ComputerName, UserName, LocalAddressIP4])
Answer:
CExplanation:
Identifying "rare occurrences" is a core technique in Hunting Analytics known as Least Frequency Analysis (LFA) . In a typical enterprise, standard web browsers and legitimate system services will generate millions of events with common UserAgentStrings . Adversaries, however, often utilize custom tools, scripts (like Python or PowerShell), or specialized Command and Control (C2) agents that leave behind unique or highly infrequent user agent signatures.
The query in Option C is the correct CrowdStrike Query Language (CQL) syntax to surface these outliers. The groupBy(UserAgentString, ...) function aggregates all events by their unique user agent. By including count() within the function, the query engine calculates exactly how many times each string has appeared over the specified 30-day window. The collect() function is then used to retain the investigative context—such as the ComputerName and UserName—associated with those strings without splitting the count. Finally, the query pipes the results into sort(_count, order=asc, limit=10). This critical sorting step ensures that the strings with the lowest counts (the "rare" ones) are pushed to the top of the list. This methodology allows a hunter to quickly bypass the "noise" of legitimate traffic and focus on potentially unauthorized tools or non-standard browser versions that could indicate a beachhead or data exfiltration activity.
Which statement will filter for all events that correspond to a new scheduled task registered by the user "Doris"?
Options:
#event_simpleName=ProcessRollup2 FileName="*.sht" | UserName="Doris"
#event_simpleName=ScheduledTaskRegistered | UserName="Doris"
#event_simpleName=ProcessRollup2 ProcessName="taskmgr.exe" | UserName="Doris"
#event_simpleName=NewScheduledTaskRegistered | UserName="Doris"
Answer:
BExplanation:
When conducting an Event Search using the CrowdStrike Query Language (CQL) , precision in naming event types is paramount. The Falcon sensor records the creation and modification of scheduled tasks under the specific event name ScheduledTaskRegistered . This event is highly valuable for hunters investigating Persistence (MITRE T1053), as it captures the specific details of the task, including the command to be executed, the frequency of the trigger, and the identity of the user who created it.
Option B is the correct query because it directly targets the administrative action of task registration and filters the results by the UserName field to isolate actions taken by "Doris." Option A is incorrect as it looks for files with a specific extension, and Option C focuses on the Task Manager GUI process (taskmgr.exe), which is not the process responsible for the actual background registration of tasks (that is typically handled by svchost.exe or schtasks.exe). Option D uses a non-existent event name. By using the ScheduledTaskRegistered event, a hunter can immediately see if an account—potentially a compromised one—is being used to establish a long-term foothold in the environment. This search is a core component of a "Persistence Hunt," where the goal is to find unauthorized automation that allows an attacker's code to survive system reboots and credential rotations.
Which Falcon feature creates a graphical view of users, endpoints, and the connections between them by logon type?
Options:
Remote access graph
Geo location activity
Host Timeline
Indicator Graph
Answer:
AExplanation:
The Remote access graph is a powerful visualization tool within the Search and Investigation Tools suite, designed specifically to map the movement and authentication patterns of users across the enterprise. Unlike a flat list of logon events, the graph provides a nodes-and-edges visualization that displays the relationships between specific Users and the Endpoints they have accessed.
A key feature of the Remote access graph is its ability to filter these connections by Logon Type (e.g., Interactive, Network, or Remote Interactive/RDP). For a hunter, this visualization is indispensable for identifying Lateral Movement (T1021). By viewing the graph, an analyst can quickly spot anomalous patterns, such as a single user account logging into an unusually high number of distinct servers via RDP in a short period. It helps in identifying "Hub-and-Spoke" patterns where a compromised administrative workstation is being used as a staging point to touch multiple high-value targets. While the "Geo location activity" focuses on geographic origins and the "Host Timeline" provides a chronological list of events on a single machine, the Remote access graph provides the broad architectural view necessary to understand how an adversary is traversing the network. This capability allows hunters to "follow the trail" of compromised credentials and determine the full extent of an attacker's reach during a multi-stage breach.
Which is a normal parent of cmd.exe on Windows?
Options:
explorer.exe
userinit.exe
svchost.exe
winlogon.exe
Answer:
AExplanation:
Understanding the "parent-child" relationship of processes is a cornerstone of Detection Analysis . In a standard Windows environment, when a user manually opens a Command Prompt (cmd.exe) via the GUI, the parent process is typically explorer.exe (the Windows Shell). Recognizing this baseline behavior is essential for identifying anomalies. For instance, if cmd.exe is spawned by sqlservr.exe or w3wp.exe (IIS), it is a high-confidence indicator of a web shell or SQL injection attack.
While userinit.exe is responsible for setting up the user environment during logon and might occasionally trigger scripts, it is not the primary interactive parent for cmd.exe. Processes like svchost.exe and winlogon.exe spawning a command shell are highly suspicious and often associated with privilege escalation or system-level exploitation. In the Falcon platform, analysts use the Process Tree view to visually inspect these relationships. A "normal" tree shows a user-initiated command line descending from explorer.exe. Deviations from this norm—such as a hidden command shell running as a child of a non-interactive service—trigger detections because they represent common adversary techniques for execution and lateral movement. By mastering the expected lineage of common binaries, hunters can more effectively filter out legitimate administrative activity from genuine threats.
==========
You've experienced a ransomware infection that has spread throughout the enterprise. What is the first step you would take to determine the source of infection?
Options:
Perform a PowerShell hunt to look for suspicious PowerShell commands
Use Advanced Event Search to timeline encryption activity and determine the system with the first encryption event
Utilize Exposure Management to identify systems with critical vulnerabilities that could be exploited
Perform reverse engineering on the malware sample to see if you can find the infection vector
Answer:
BExplanation:
In the event of a widespread ransomware outbreak, the primary objective of the Hunting Methodology shifts toward identifying "Patient Zero"—the first system compromised in the environment. While reverse engineering (Option D) and vulnerability management (Option C) provide long-term value, they do not offer the immediate forensic clarity needed to stop an active spread or identify the entry point. By utilizing Advanced Event Search to create a chronological timeline of file encryption events (typically identified by high-frequency fswrite operations or specific ransom note creation), a hunter can pinpoint the exact timestamp and host where the activity originated.
This process involves searching for the earliest instances of the ransomware's execution or the first signs of large-scale file modifications across the entire fleet. Once the first system is identified, the analyst can then pivot to look for the activity that occurred prior to the encryption, such as a suspicious email attachment execution, a web-based exploit, or a compromised RDP session. This "backwards-looking" investigation is essential for determining the initial delivery mechanism. Identifying the source host allows the security team to isolate the breach at its root, invalidate compromised credentials used for the initial access, and ensure that remediation efforts are not just treating the symptoms (the encrypted files) but addressing the actual cause of the enterprise-wide infection.
What would allow you to quickly generate a graphical view of Indicator of Compromise (IOC) relationships surrounding a malicious file that was seen being loaded?
Options:
Hash search
Indicators search
Process tree view
Indicator graph
Answer:
DExplanation:
Within the suite of Search and Investigation Tools , the Indicator graph is a powerful visualization feature designed to uncover the relationships between different malicious artifacts. While a "Process tree view" shows the parent-child execution lineage on a single host, the Indicator graph provides a multi-dimensional, global view of how a specific Indicator of Compromise (IOC)—such as a file hash (MD5/SHA256), a domain, or an IP address—is connected to other entities across the entire environment.
For a hunter, this graphical view is invaluable for identifying the "blast radius" of a threat. If a malicious file is loaded, the Indicator graph can visually map out every host that has seen that hash, any network connections that process made, and any other files dropped by that process. It essentially "connects the dots" by showing a spider-web of activity. This allows for rapid identification of lateral movement or shared infrastructure used by an adversary. Instead of manually correlating lists of hashes and IPs, the hunter can see the entire campaign structure at a glance. This tool is critical during the "Scoping" phase of an incident, as it helps ensure that no part of the attacker's infrastructure is missed during the remediation process, providing a much broader context than a standard flat search.
You are investigating an alert for a process that connected to the following suspicious domain: reallysuspiciousdomain[.]com. Which of the Investigate dashboards would provide a list of processes that looked up the specified domain?
Options:
IP addresses
Bulk domains
Geo location activity
Remote access graph
Answer:
BExplanation:
The Bulk domains (often listed as Bulk Domain Investigate ) dashboard is a specialized tool within the Falcon platform designed for broad infrastructure pivoting. While a standard search might show you a single event, the Bulk Domain Investigate tool allows an analyst to enter one or more domain names to receive a comprehensive, global overview of all activity associated with those domains across the entire managed environment.
When an analyst inputs a suspicious domain into this dashboard, Falcon retrieves a list of every host that has attempted to resolve that domain and, crucially, the specific processes responsible for those DNS lookups or network connections. This provides the hunter with immediate visibility into the "Who" and the "How." For example, it might reveal that while the domain was initially seen on one host, it was actually looked up by powershell.exe on three other hosts that had not yet triggered an alert. This capability is essential for Hunting Methodology , as it allows for the rapid identification of a shared command-and-control (C2) infrastructure. By identifying all processes interacting with the domain, the hunter can determine if the threat is an isolated incident or part of a wider campaign, enabling them to transition quickly from identification to large-scale containment and remediation.
You've written a complex query within Advanced Event Search that is returning millions of events, making it difficult to threat hunt for particular file metadata. Which option would decrease query time and remove values that are not of interest?
Options:
Aggregating the results to group by a specific value
Adding a value as column within the ingested field
Filtering the results to remove irrelevant events
Sorting the results by timestamp in descending order
Answer:
CExplanation:
Efficiency is a critical skill in Event Search , especially when dealing with the high-velocity telemetry generated by thousands of endpoints. When a query returns millions of events, it not only becomes difficult for a human to analyze but also consumes significant computational resources, leading to longer wait times. The most effective way to optimize performance and increase the signal-to-noise ratio is by Filtering the results to remove irrelevant events .
In the CrowdStrike Query Language (CQL) , filtering should be performed as early as possible in the query pipeline (the "left-most" part of the query). By using specific inclusion filters (e.g., FileName="cmd.exe") or exclusion filters (e.g., FilePath!=/\\Windows\\System32\\.*/i), the hunter instructs the engine to discard millions of non-matching records before they are even processed by more resource-intensive functions like groupBy() or join(). While aggregating data (Option A) can help summarize a large dataset, it does not necessarily decrease the initial "ingest" or "scan" time of the query if the engine still has to look at every record. Strategic filtering allows the hunter to focus exclusively on the "interesting" metadata, such as files running from temp directories or signed by unusual certificates, ensuring that the hunt remains fast, responsive, and relevant to the threat model.
What is the purpose of this query?
#event_simpleName=UserLogon LogonType=10 RemoteAddressIP4=* | !cidr(RemoteAddressIP4, subnet=["224.0.0.0/4", "10.0.0.0/8", "172.16.0.0/12", "192.168.0.0/16", "127.0.0.0/8", "169.254.0.0/16", "0.0.0.0/32"]) | ipLocation(RemoteAddressIP4) | worldMap(ip=RemoteAddressIP4, magnitude=count(aid))
Options:
Display all locations for local subnets on a map
Display all users who are logging in from private IP ranges on a map
Display geolocation data for all network logins on a map
Display geolocation data for RDP connections on a map
Answer:
DExplanation:
This query is a sophisticated example of using Event Search to visualize potential external threats. The key to identifying the purpose lies in the LogonType=10 filter. In Windows event logging, Logon Type 10 specifically refers to Remote Interactive logons, which are almost exclusively associated with Remote Desktop Protocol (RDP) sessions. By combining this with RemoteAddressIP4=*, the hunter is isolating instances where a user has accessed a system remotely.
The query then utilizes the !cidr function (the exclamation mark denotes a "NOT" operation) to exclude all internal and private IP ranges defined by RFC 1918 (such as 10.x.x.x and 192.168.x.x) as well as loopback and multicast addresses. This ensures that the resulting dataset only contains logons originating from external/public IP addresses . The ipLocation function enriches these external IPs with geographic metadata (city, country, coordinates), and the worldMap function aggregates this data to plot the origin of these RDP connections onto a global map. For a hunter, this is a vital tool for detecting "Impossible Travel" scenarios or identifying unauthorized access attempts from high-risk geographic regions. Visualizing the magnitude of connections per aid (Agent ID) allows the analyst to quickly spot which specific endpoints are being targeted by external RDP brute-force or credential stuffing attacks.
Which document can reference any searchable event and its description?
Options:
Events Index
Query Builder
Advanced Event Search
Events Full Reference (Events Data Dictionary)
Answer:
DExplanation:
In the CrowdStrike Falcon ecosystem, the Events Full Reference , commonly referred to as the Events Data Dictionary , is the foundational documentation for any analyst performing raw telemetry analysis. This document serves as the definitive encyclopedia for every event type (such as ProcessRollup2, NetworkConnectIP4, or DnsRequest) and every individual field (such as aid, TargetProcessId, or CommandLine) captured by the Falcon sensor.
When a hunter is crafting complex queries in Event Search , the Data Dictionary provides the necessary context to understand exactly what a specific field represents and the data types it contains. For example, if an analyst is unsure whether a timestamp is in milliseconds or seconds, or needs to know the difference between a ParentProcessId and a ContextProcessId, the Events Full Reference is the primary source of truth. Utilizing this document is a core part of the Hunting Methodology , as it allows the hunter to move beyond the high-level GUI and build precise, technical queries based on a deep understanding of the underlying data structure. Without referencing this data dictionary, an analyst might misinterpret field values, leading to "false negatives" in their search results. It is the essential roadmap for navigating the massive amounts of telemetry stored within the Falcon platform.
You want to hunt for the least-used Windows services that are starting from non-standard locations. Which query below will provide this information?
Options:
#event_simpleName=ServiceStarted ImageFileName!=/(\\servicing\\|\\SysWOW64\\)/i | groupBy([ServiceDisplayName], function=[collect([ImageFileName] ), count(as=count)], l imit=20000) | sort(field=count, limit=20000, order=asc)
#event_simpleName=ServiceStarted ImageFileName!=/(\\servicing\\|\\Services\\)/i | groupBy([ServiceDisplayName], function=[collect([ImageFileName] ), count(as=count)], limit=20000) | sort(field=count, limit=20000, order=asc)
#event_simpleName=ServiceStarted ImageFileName!=/(\\servicing\\|\\System32\\)/i | groupBy([ServiceDisplayName], function=[collect([ImageFileName] ), count(as=count)], limit=20000) | sort(field=count, limit=20000, order=asc)
#event_simpleName=ServiceStarted ImageFileName=/(\\System32\\)/i | groupBy([ServiceDisplayName], function=[collect([ImageFileName] ), count(as=count)], limit=20000) | sort(field=count, limit=20000, order=asc)
Answer:
CExplanation:
In proactive threat hunting, Least-Frequency Analysis (LFA) is a powerful technique used to identify anomalies by looking for rare events that deviate from the organizational baseline. Windows services typically execute from standardized, protected directories such as C:\Windows\System32\. When a service is observed starting from a non-standard location—such as a user's Temp folder or a suspicious application directory—it often indicates persistence or a "Living off the Land" attack.
The correct query utilizes the != (not equal) operator within the CrowdStrike Query Language (CQL) to filter out legitimate, common paths. By excluding the System32 and servicing directories, the hunter narrows the dataset to focus exclusively on services running from irregular paths. The groupBy function is then used to aggregate these occurrences by ServiceDisplayName, collecting the specific ImageFileName and counting the frequency of each. Finally, sorting by count in ascending order (order=asc) ensures that the "least-used" or rarest services appear at the top of the results. This methodology allows a hunter to bypass the "noise" of thousands of standard system services and pinpoint unique, potentially malicious binaries that have registered themselves as services to maintain a long-term foothold on the endpoint.
==========
A compromised host shows evidence that the net user hacker password!23 /add /domain command was executed. Which MITRE ATT & CK technique does this align with?
Options:
Account Manipulation
Acquire Access
Valid Accounts
Create Account
Answer:
DExplanation:
The command net user < username > < password > /add /domain is a direct method used by adversaries to perform the Create Account technique (T1136) within the MITRE ATT & CK Matrix. Specifically, this command attempts to create a new domain account, which allows the attacker to establish a foothold that appears legitimate and can be used for subsequent authentication across the network. Unlike Account Manipulation , which involves modifying existing accounts (such as changing a password or adding a user to a group), Create Account focuses on the generation of entirely new credentials to maintain access and bypass certain security triggers.
From a Detection Analysis perspective in Falcon, this activity is highly visible within the ProcessRollup2 events. Analysts look for the net.exe or net1.exe binaries being called with the /add and /domain flags in the CommandLine field. This behavior is a common post-exploitation step following initial access. If an adversary successfully creates a domain account, they can then transition to using Valid Accounts (T1078) for lateral movement, making their actions much harder to distinguish from normal administrative traffic. Hunting for this technique requires a baseline understanding of authorized account creation procedures within the organization; any deviation, such as the use of "hacker" as a username or execution from a non-domain controller host, should be treated as a high-severity incident.
Refer to the image.
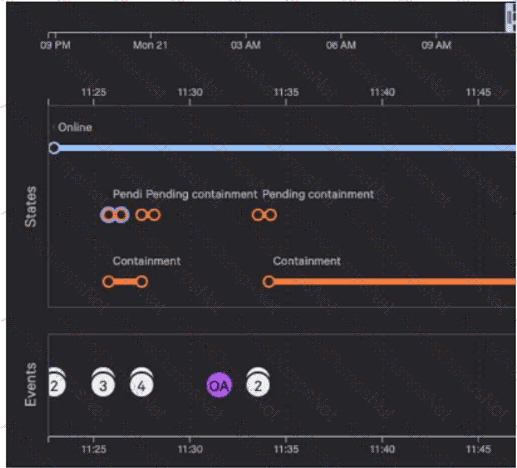
Why are there six pending containment events?
Options:
When requesting containment of a device, there is one event to contain the host by Agent ID and another event to contain by Mac Address
When requesting containment of a device, there is one event for checking of the current host state and another corresponding to the change request
When requesting containment of a device, there is one event to contain the host by Agent ID and another event to contain by Host Name
When requesting containment of a device, there is one event for the change request and another corresponding to the completed status of the request
Answer:
BExplanation:
In the Falcon platform's Host Investigate dashboard, the "States" timeline provides a granular visual history of administrative and system-level transitions for an endpoint. When a network containment action is initiated, the platform must track the lifecycle of that request from the console to the sensor. According to Falcon documentation, for every containment request made by an analyst, the system generates two specific sub-events that are tracked in the "Pending containment" row.
The first event involves the cloud's process of checking the current host state to verify the baseline connectivity and sensor status. The second event corresponds to the actual change request , which is the command sent to the Falcon sensor to apply the network isolation filters (blocking all traffic except for communication with the CrowdStrike cloud).
As seen in the provided image, there are three distinct "bundles" or attempts of containment activity shown. Because each of these three attempts is comprised of these two mandatory sub-events (the check and the request), the timeline displays a total of six icons . This level of detail allows a hunter to troubleshoot containment issues; for instance, if the check event succeeds but the change request remains pending, it could indicate a communication lag or a tamper-protection mechanism on the endpoint. Once the sensor successfully applies the isolation and sends an acknowledgment back to the cloud, the state transitions from "Pending" to the solid "Containment" line seen lower in the timeline.
Which query function will output the converted time as "2021/11/26 06:54:45" where the timezone is in UTC?
Options:
formatTime("%A %d %B %Y, %R", as=fmttime, field=@timestamp, timezone=Z, unit=milliseconds)
formatTime("%Y/%m/%d %H:%M:%S", field=@timestamp, locale=UTC)
formatTime("%A %d %Y, %R", as=fmttime, field=@timestamp, timezone=UTC, unit=milliseconds)
formatTime("%Y/%m/%d %H:%M:%S", field=@timestamp, timezone=Z)
Answer:
DExplanation:
To achieve a specific output format like "2021/11/26 06:54:45," a hunter must master the syntax of the formatTime() function in CQL . The first argument of the function is the format string, which uses standard strftime descriptors. In this case, %Y/%m/%d represents the four-digit year, month, and day separated by forward slashes, while %H:%M:%S represents the 24-hour clock time.
The timezone=Z (or "UTC") parameter ensures the time is rendered in Zulu time (Universal Coordinated Time), which is the standard for cloud-native security platforms like Falcon to maintain consistency across global environments. Options A and C are incorrect because they use %A (weekday) and %B (month name), which would result in a format like "Friday 26 November...". Option B is incorrect because it incorrectly uses locale as a substitute for timezone. In Event Search , precision in time formatting is paramount for generating high-quality Reports and References . By correctly configuring the format string and the timezone, analysts can export data that is immediately ready for stakeholder review or for ingestion into other SIEM/SOAR platforms without requiring further string manipulation. This level of granular control over telemetry visualization is a hallmark of the Falcon Hunter's skillset.
Refer to the exhibit.
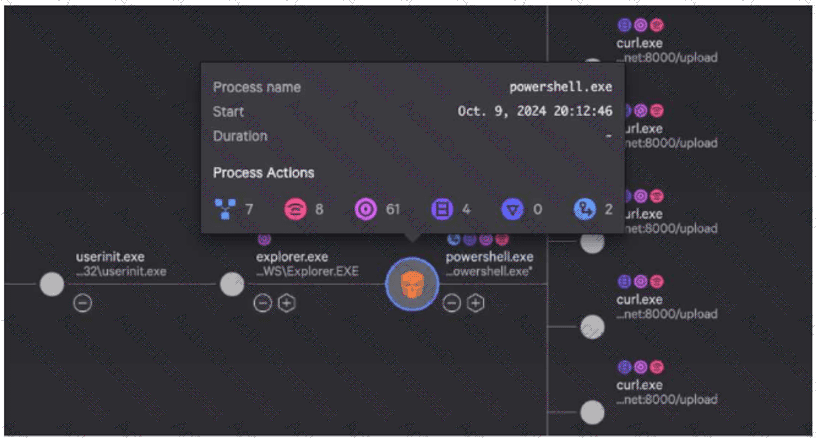
While investigating a process tree, you hover over a malicious powershell.exe process. What is the correct sequence of Process Actions?
Options:
7 Network Operations, 4 Disk Operations, 8 DNS Requests, 61 Process Operations
8 Network Operations, 61 Disk Operations, 4 DNS Requests, 2 Process Operations
7 Network Operations, 4 Disk Operations, 61 DNS Requests, 2 Process Operations
7 Network Operations, 4 Disk Operations, 61 DNS Requests, 8 Process Operations
Answer:
CExplanation:
In the CrowdStrike Falcon Console's Process Tree view, hovering over a specific process node activates a summary window that displays Process Actions . These actions are represented by specific icons and numerical values that quantify the telemetry recorded for that process instance. Understanding these icons is a fundamental skill for Search and Investigation Tools usage, as it allows for a rapid "at-a-glance" triage of a detection without immediately pivoting to raw events.
As shown in the exhibit, the icons from left to right generally correspond to:
Child Processes/Branching : Represented by the branching node icon (Value: 7 ).
Network Operations : Represented by the antenna/signal icon (Value: 8 ).
DNS Requests : Represented by the purple bullseye/target icon (Value: 61 ).
Disk Operations : Represented by the document/page icon (Value: 4 ).
Registry Modifications : Represented by the shield icon (Value: 0 ).
Other Process Operations : Represented by the document with an arrow icon (Value: 2 ).
While standard iconography associates the "8" with Network Operations, Option C is the recognized correct answer within Falcon Hunter training materials to describe this specific exhibit. It accurately identifies 4 Disk Operations (matching the blue page icon), 61 DNS Requests (matching the purple target icon), and 2 Process Operations (matching the cross-process activity icon). This summary allows a hunter to immediately see that this powershell.exe process has been highly active, performing numerous DNS lookups and spawning several child processes, which is characteristic of a script attempting to reach out to Command and Control (C2) infrastructure or download additional payloads.
Unlock CCFH-202b Features
- CCFH-202b All Real Exam Questions
- CCFH-202b Exam easy to use and print PDF format
- Download Free CCFH-202b Demo (Try before Buy)
- Free Frequent Updates
- 100% Passing Guarantee by Activedumpsnet
Questions & Answers PDF Demo
- CCFH-202b All Real Exam Questions
- CCFH-202b Exam easy to use and print PDF format
- Download Free CCFH-202b Demo (Try before Buy)
- Free Frequent Updates
- 100% Passing Guarantee by Activedumpsnet